Introducing Show Leaderboards & Interactive Profiles
Until now, finfluencers.trade gave you a finfluencer leaderboard and fairly basic per-person stats — enough to browse names, not enough to decide where your listening time should go.
This release is a major update. You can now rank entire shows and podcasts the same way you rank individual hosts, open a full profile for each show, compare panelists on rotating desks, and dig into finfluencer pages with the same holding-period tools throughout. The goal is simple: help you spend finite listening hours on sources that have actually delivered alpha vs the S&P 500 — whether that is one program or several.
Which shows and podcasts are worth your listening time?
Financial media consumes real hours. It makes sense to prioritize sources that have delivered the most alpha vs the S&P 500 — not the ones with the best promos. How many shows you follow is up to you; the Show Leaderboard lets you compare all tracked programs side-by-side and sort by the holding period you care about (1w, 1m, 3m, 6m, 1y).
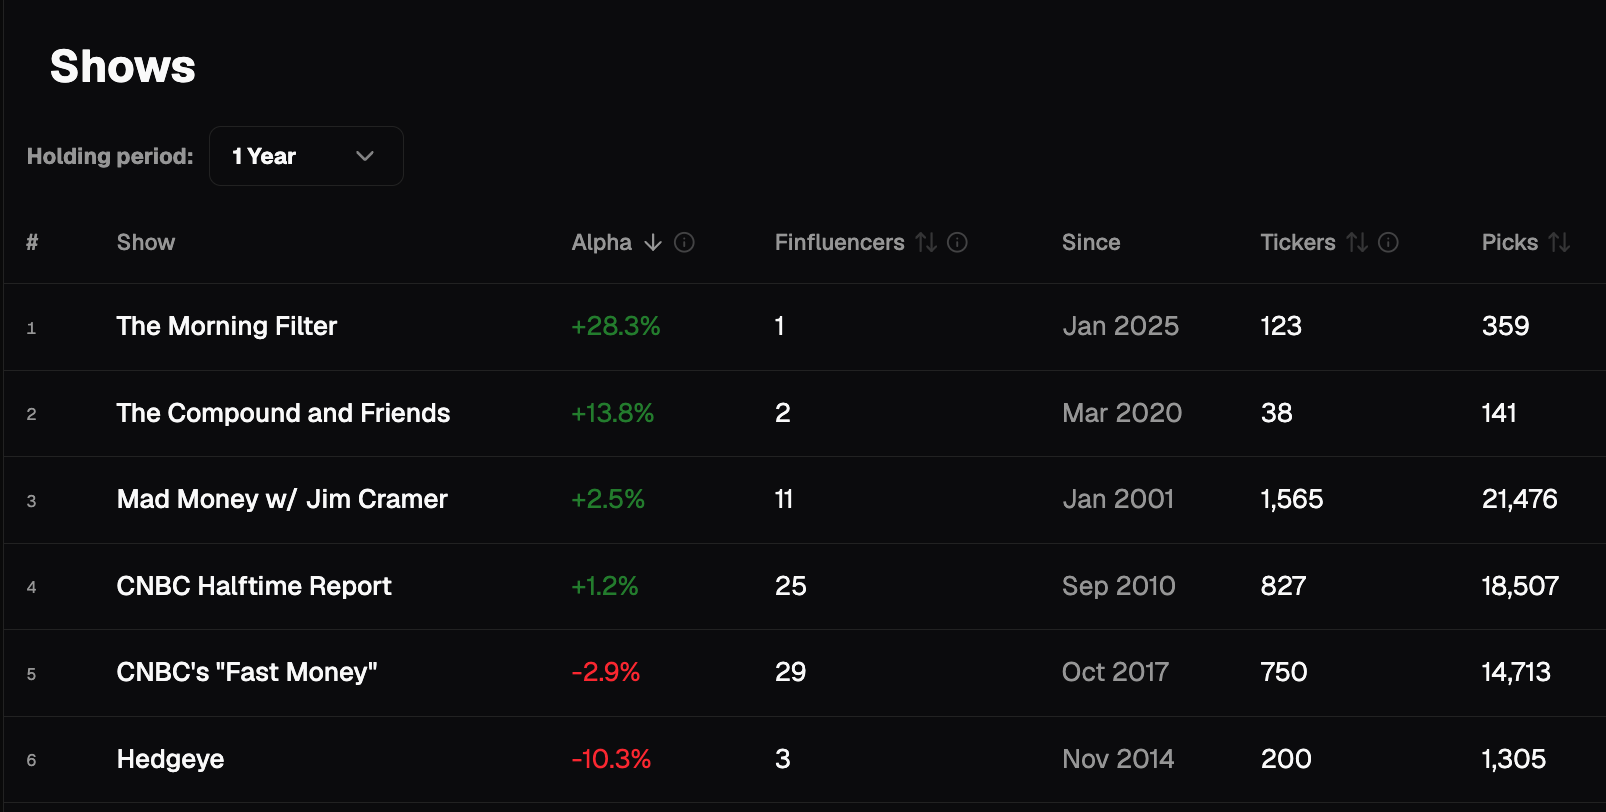
👉 Explore the Show Leaderboard
How does a show perform on hit rate, return, and alpha?
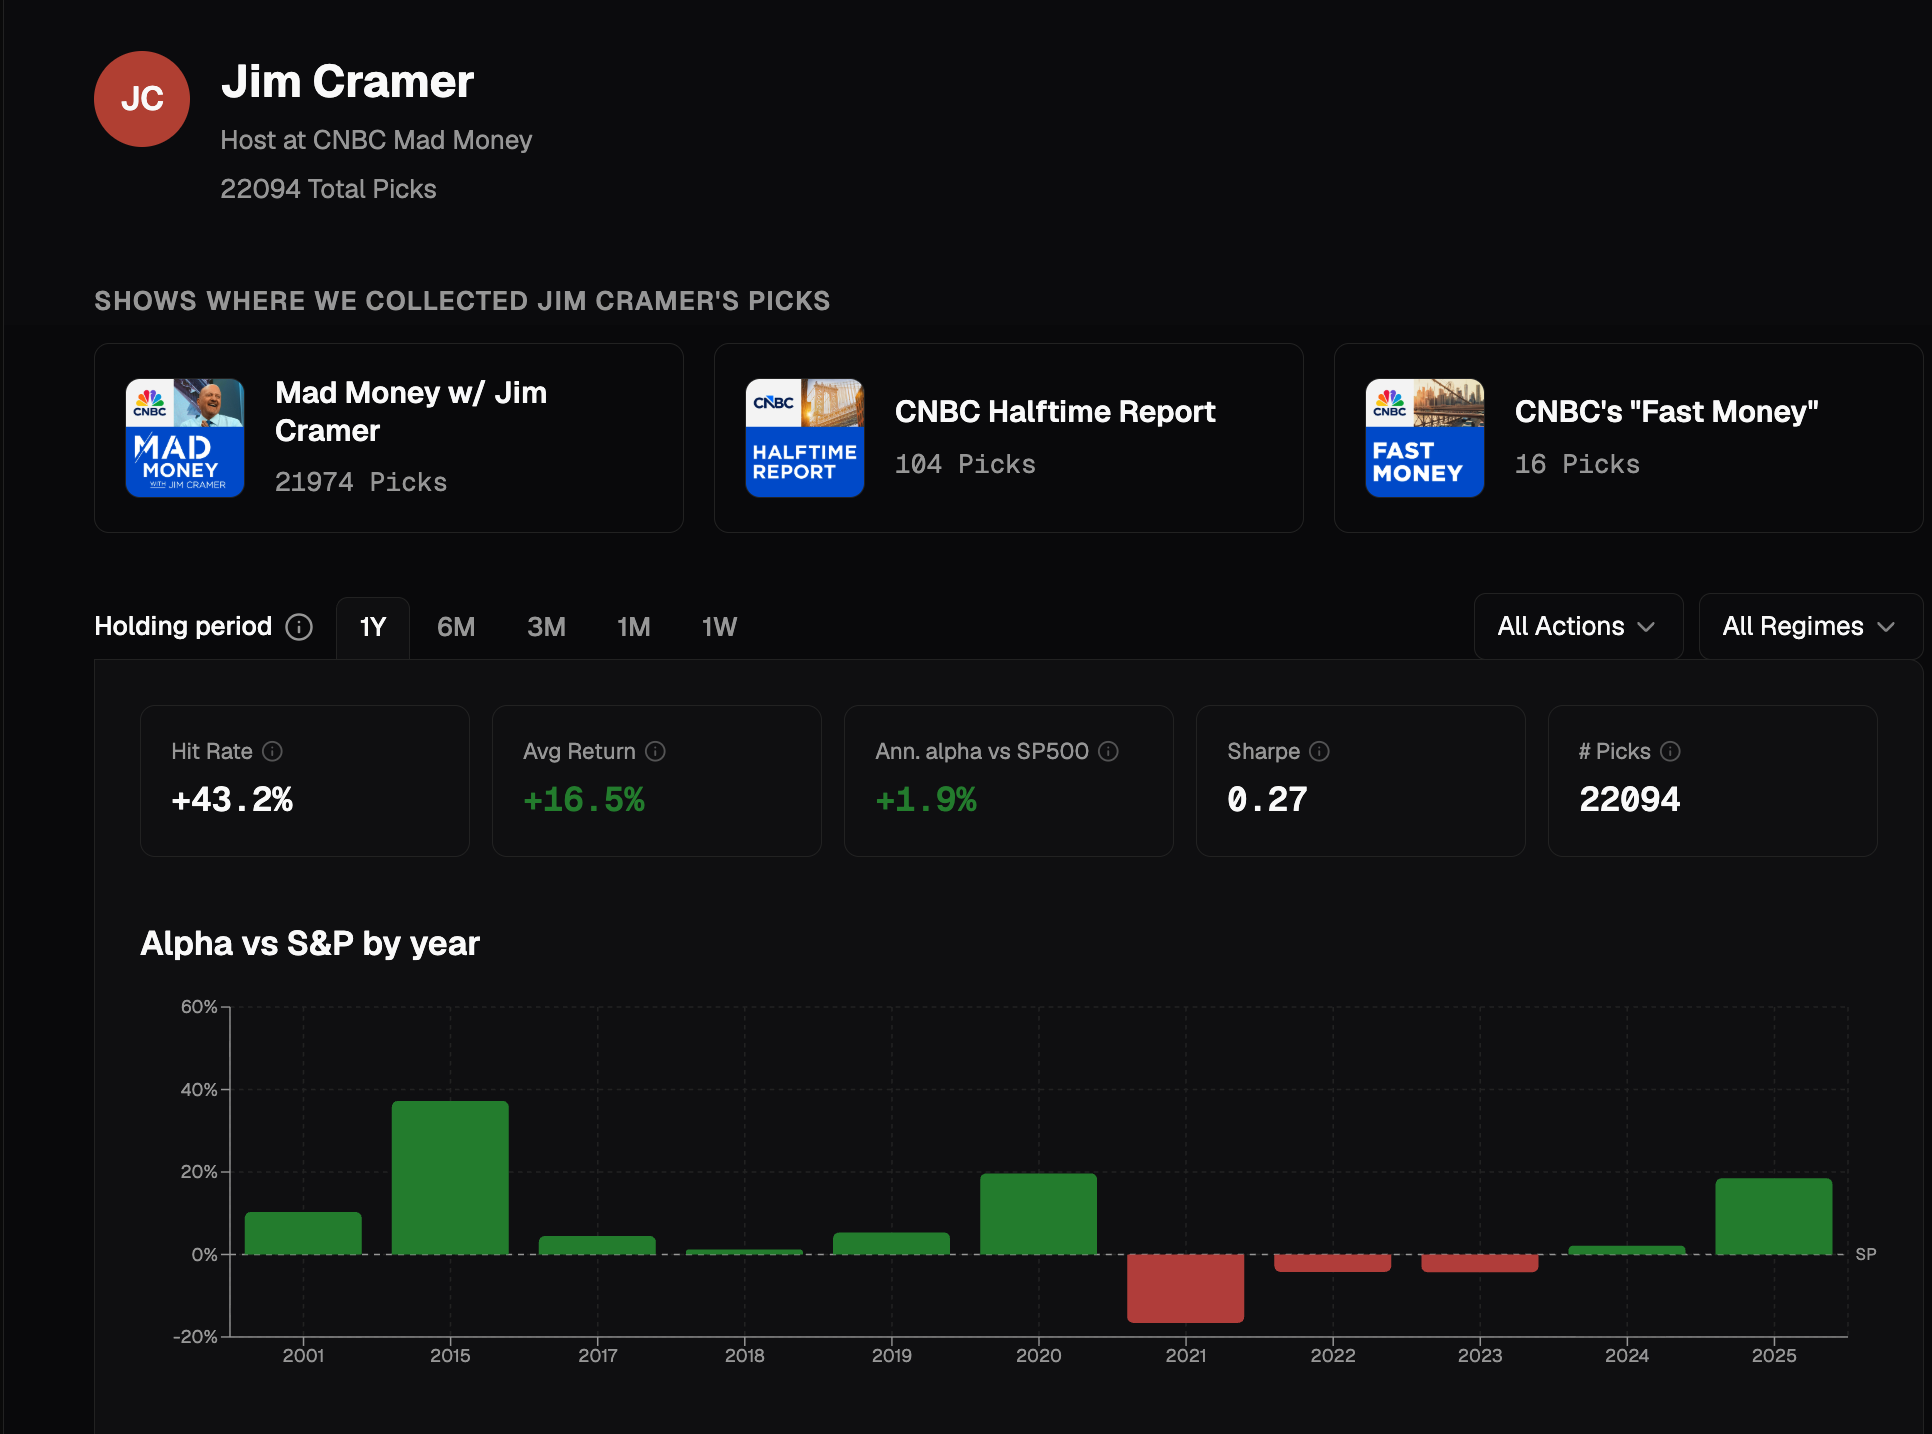
Once you shortlist a show, its profile summarizes the track record for your horizon and filters: hit rate, average return, annualized alpha vs the S&P 500, Sharpe, and total pick count. The same page also surfaces best and worst individual calls, pick volume over time, ticker rankings, and (for panel shows) a panelist leaderboard.
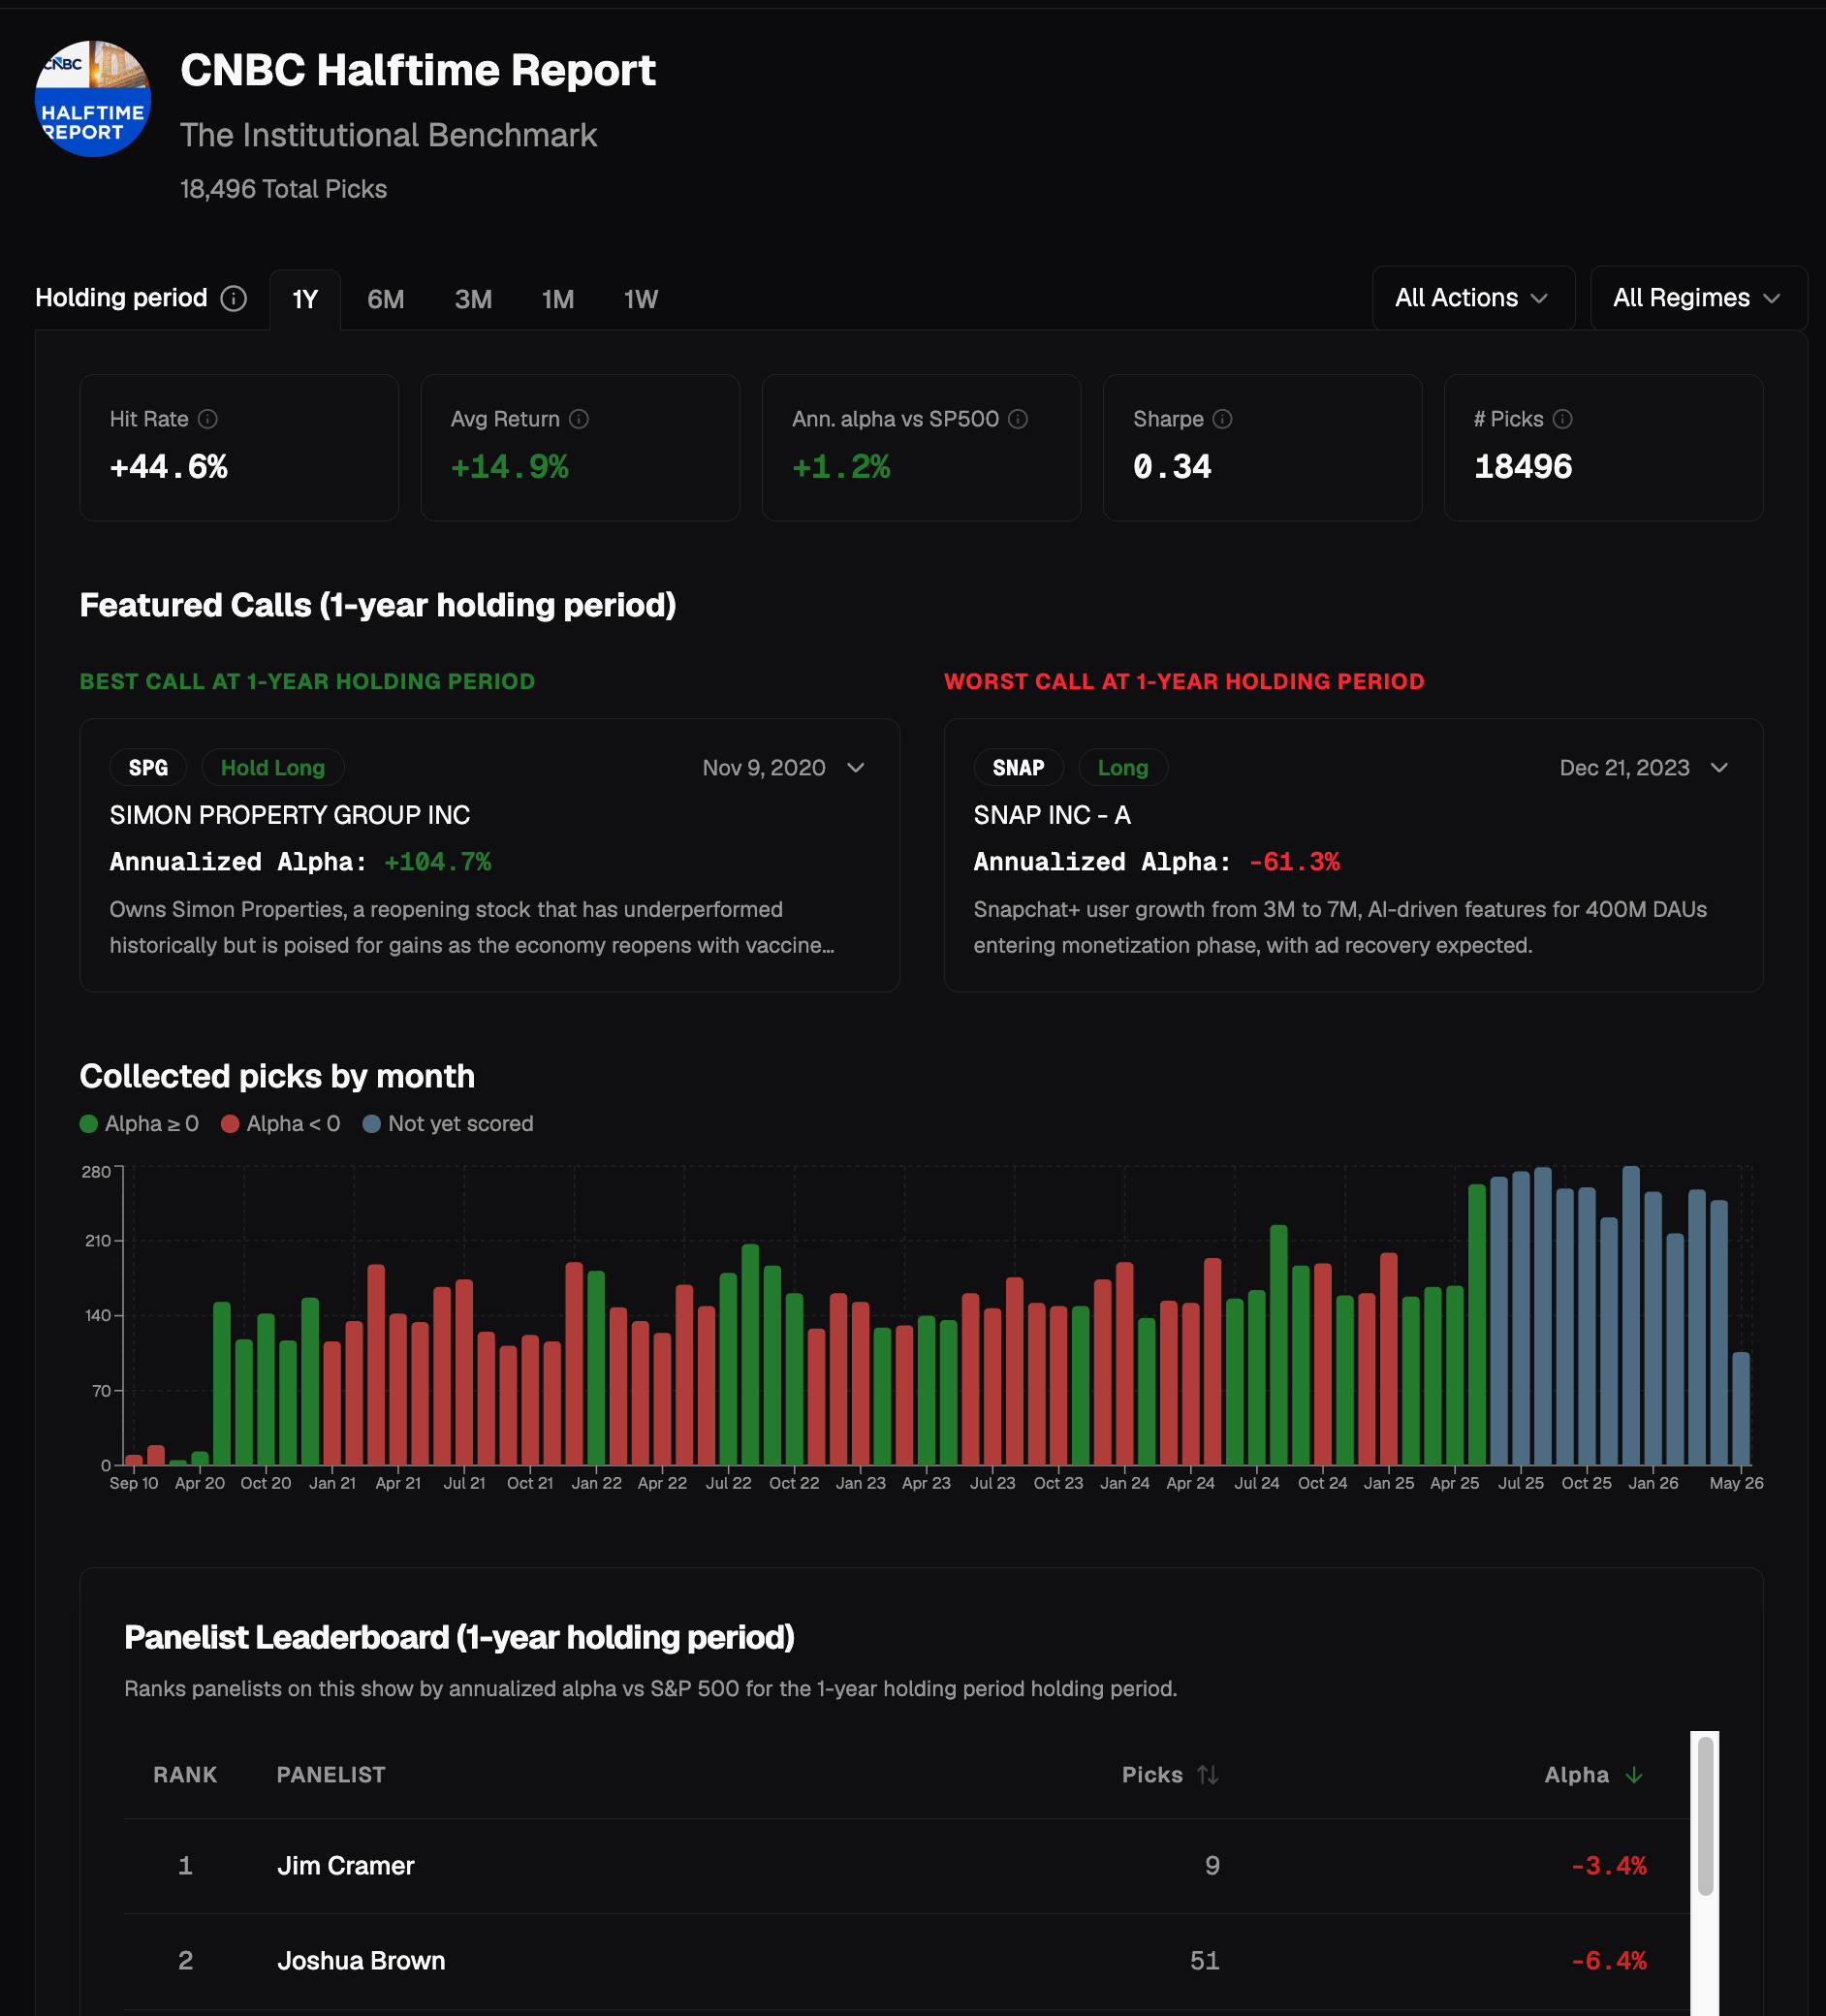
👉 Open the Halftime Report profile
What gets talked about most — and what actually worked?
Every show profile and finfluencer profile includes three ticker tables that answer different questions at the same holding period:
- Most Picks — the names that dominate the conversation (frequency ≠ quality: a heavily mentioned ticker can still show negative alpha).
- Performers — the tickers with the highest average alpha in the slice; often a mix of repeat names and one-off home runs.
- Laggards — the worst alpha contributors — useful for spotting recurring mistakes, not just forgotten long shots.
All three respect the same action and regime filters as the rest of the page, so you are not comparing apples from one slice with oranges from another.
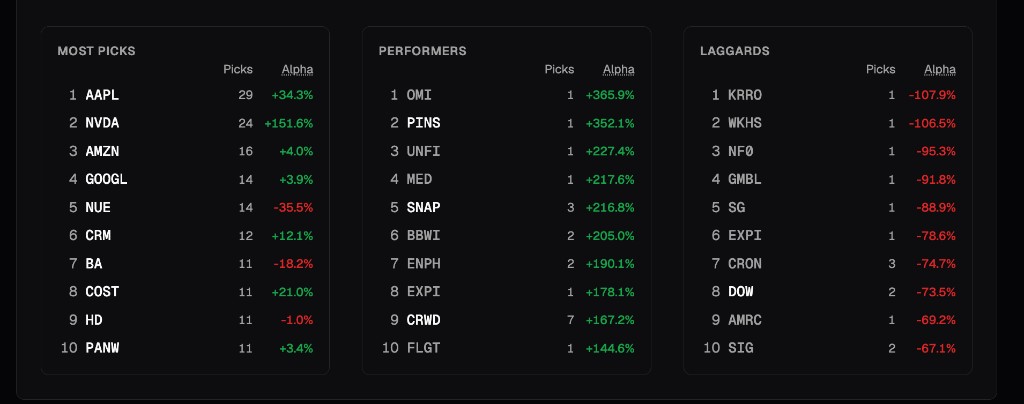
👉 Jim Cramer — finfluencer example · Halftime Report — show example
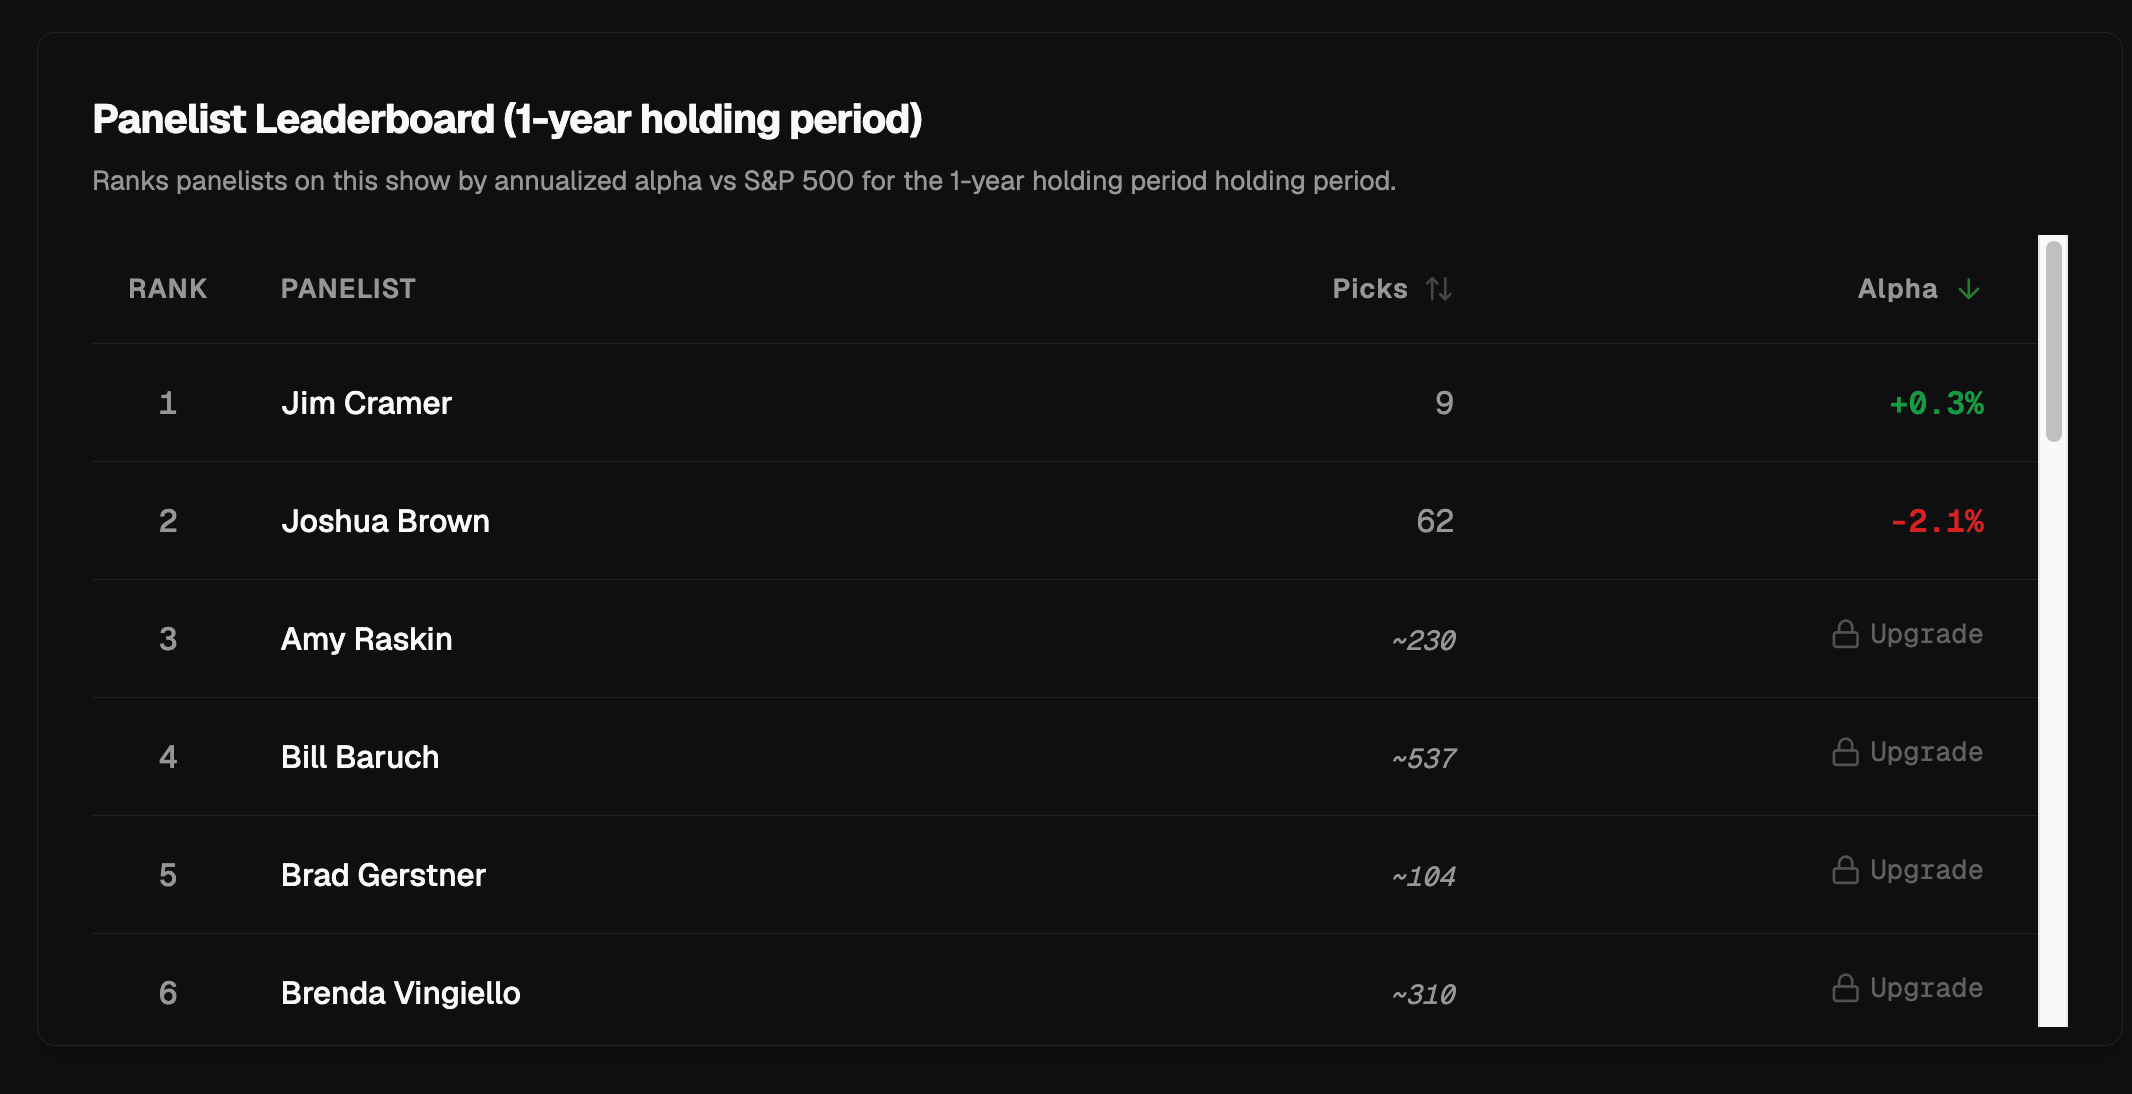
On a rotating panel, who is carrying the show — and who is dragging?
Shows like CNBC Halftime Report and Fast Money rotate traders across episodes. The Panelist Leaderboard ranks contributors by annualized alpha vs the S&P 500 for the active holding period, with pick counts so you can see whether the ranking rests on a deep sample or a few calls.
When someone appears on several shows, where do their picks actually come from?
Many finfluencers show up on more than one tracked program — Mad Money, Halftime, Fast Money, and others. The multi-show cards at the top of the profile break down pick counts by source.
Does naming the same ticker repeatedly pay off?
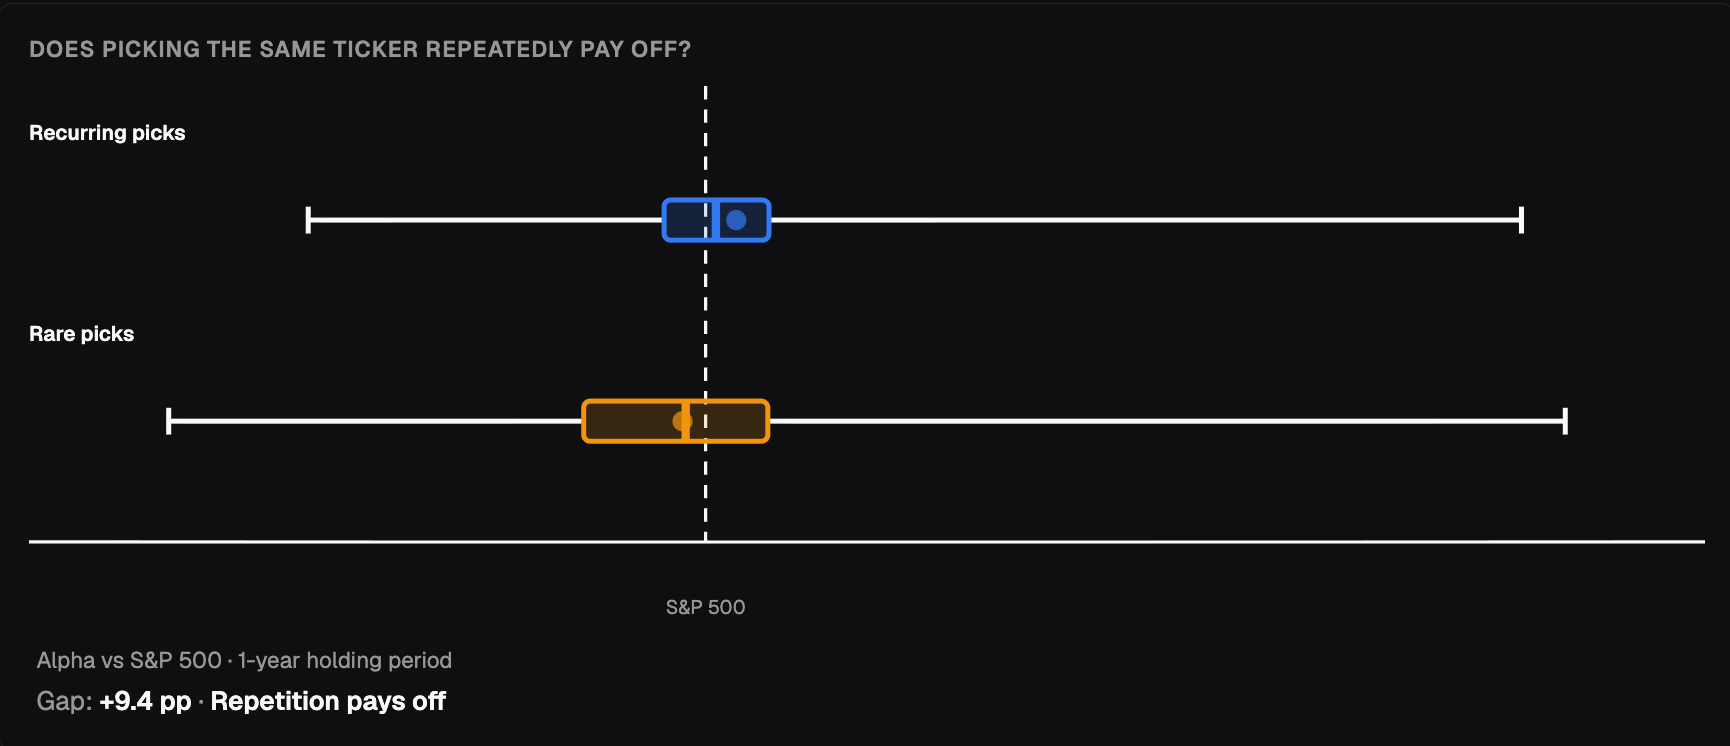
Some hosts mention the same names week after week; others rotate constantly. The payoff box plot compares recurring picks vs rare one-offs against the S&P 500 at the selected holding period.
What were the best and worst individual calls?
Best-call and worst-call cards highlight the single strongest and weakest scored picks at the active horizon, with a snippet of the original reasoning. The monthly pick activity chart shows how pick volume evolved and which months are still awaiting scores.
👉 Jim Cramer’s profile — best/worst calls and pick activity · Halftime Report — show-level example
Where to start
Last updated: 2026-05-26