Cumulative Curves, Head-to-Head Compare, and Every Show We Track
Rankings tell you the score. They don’t show the race.
finfluencers.trade now has cumulative return curves, Compare for head-to-heads, and a full Shows leaderboard — so you can see who pulled ahead, who faded, and which programs are worth your listening hours.
finfluencers.trade tracks what financial media personalities and podcast hosts actually said about stocks. For each clear call, we put that instrument into a hypothetical portfolio — long or short, depending on the direction of the pick — starting on the pick date, and we keep it there for a fixed holding period (one week, one month, three months, six months, or one year). Then we measure how that position did versus the S&P 500 over the same window.
Open Compare, pick two finfluencers, same holding period and chart period. Optionally add the S&P 500 as a comparing line.
Cumulative performance on every profile
On a finfluencer profile you get a cumulative return chart for their hypothetical equal-weight pick book over the chart window you choose. Optionally include the S&P 500 on the same chart as a comparing instrument. The lines are cumulative returns — the chart does not plot alpha (the gap versus the index).
Two controls:
- Holding period (
1w/1m/3m/6m/1y) — how long each pick stays in the hypothetical portfolio from its pick date; this chooses which scored book you are looking at. - Chart period — how far back from today the chart looks (1m through max). It does not change which picks are in the book; it only sets the lookback window for the curve.
Hit Play to animate the path.
When the portfolio has no open picks, it tracks the S&P 500 for that stretch (not cash sitting idle) — so empty periods are not a cash drag. The path inside the window is modelled for readability — use it for the race story, not for deriving drawdown or Sharpe from the curve itself. Details live on Methodology.
Head-to-head: Compare
Want Buffett-vs-Wood energy without the folklore? Open Compare in the sidebar (or the Compare button on a profile), pick two names, and run them on the same holding period and chart period. Same idea as the profile chart: cumulative returns for each book, with an optional S&P 500 comparing line.
Both sides need coverage on the holding period you choose; if a pair has no shared holding period yet, Compare will say so and you can pick another combination.
Export the race for social
From the chart, export a watermarked PNG, JPEG, or MP4 (Play animation as video) in 1:1, 9:16, or 16:9. Same numbers as on screen — one series feeds the interactive chart and the export. Handy when you want to post a still or a short “who won?” clip without screenshot archaeology.
Show Leaderboard: rank the show/podcast, not just the host
The finfluencer Leaderboard answers “who?” Shows answers “which show or podcast is worth your listening time?” Rank entire shows/podcasts by annualized alpha vs the S&P 500 at the holding period you care about, then open a show profile for hit rate, best/worst calls, ticker tables, and (on rotating desks) a panelist leaderboard.
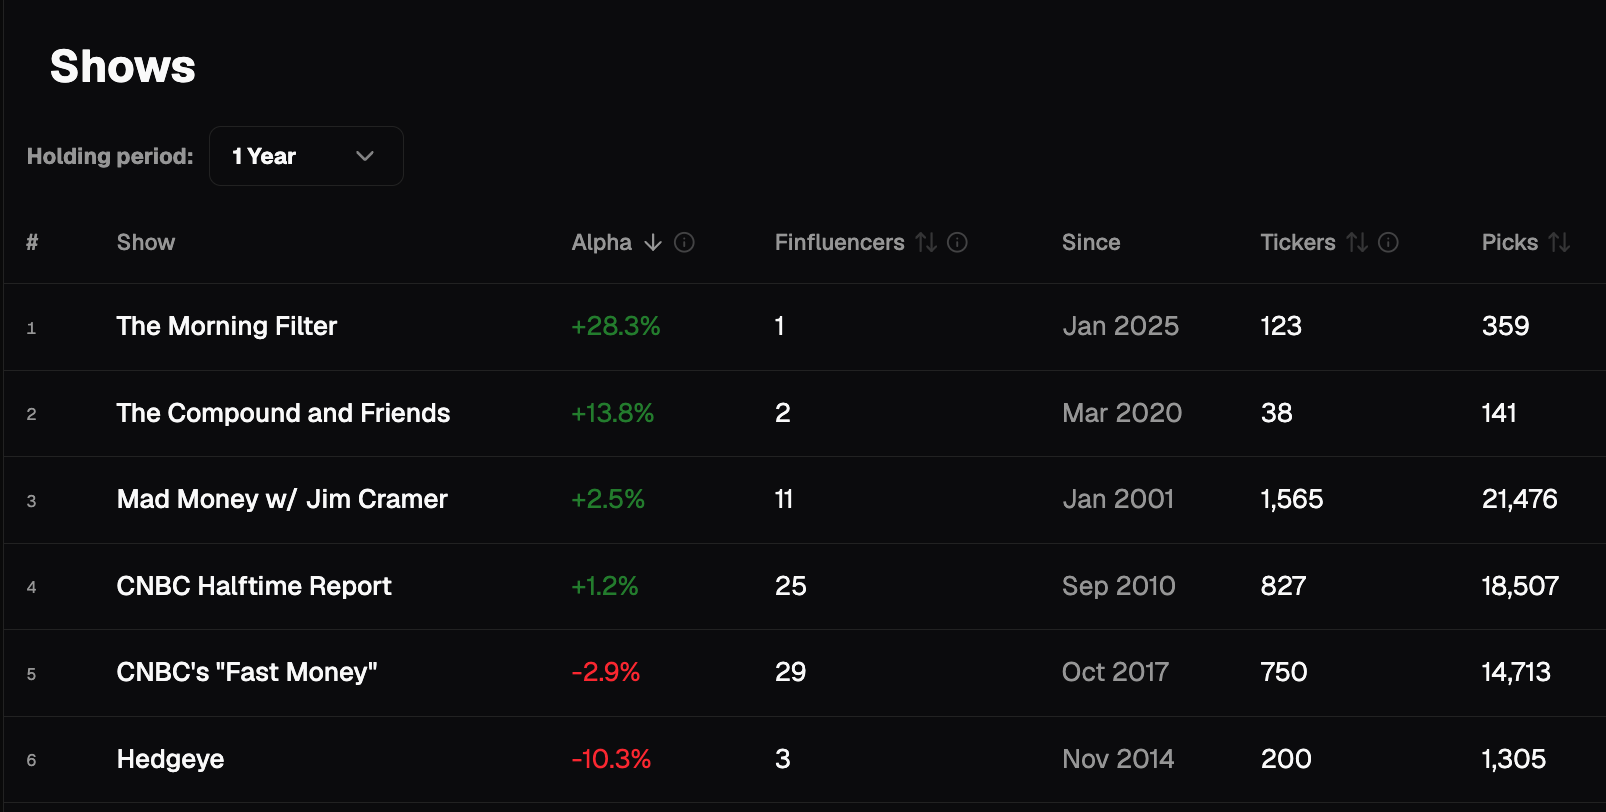
Shows we track today
Full roster currently under Shows (1y holding period snapshot; rankings move as new picks score):
- The Compound and Friends
- Mad Money w/ Jim Cramer
- Investing Unscripted
- The Morning Filter
- Motley Fool Hidden Gems Investing
- CNBC Halftime Report
- CNBC's "Fast Money"
- The Acquirers Podcast
- Chit Chat Stocks
- The 7investing Podcast
- Hedgeye
More shows will be added as they score.
Where to start
Run a head-to-head
Pick two finfluencers in Compare — same holding period and chart period, optional S&P 500 line.
Shows
See which shows beat the S&P 500 at the holding period you care about — then open a show profile.