Six Months Is the Holding Period We Start From
Every scored pick on finfluencers.trade is measured at five holding periods: 1 week, 1 month, 3 months, 6 months, and 1 year. A table still has to open on one of them. We start from 6 months, because that is how long the market, on average, holds a share.
Eight years became six months
The implied holding period is the inverse of annual turnover: total shares outstanding divided by annual share volume. The New York Stock Exchange has published that turnover since the 1920s. In 1960 it was about 12% to 14% a year — roughly 8.3 years. By 2008–2010 it was over 200% a year — roughly 6 months.
Reuters, using the same NYSE series, put the average holding period for U.S. equities at 5.5 months in June 2020, down from 8.5 months at the end of 2019. Ned Davis Research charts the same collapse from the 1920s. James Montier, in The Little Book of Behavioral Investing and in GMO notes on "the churn and burn age", used Dresdner Kleinwort and NYSE data to describe the same shift: from 7-to-8-year capital allocation to short-term trading.
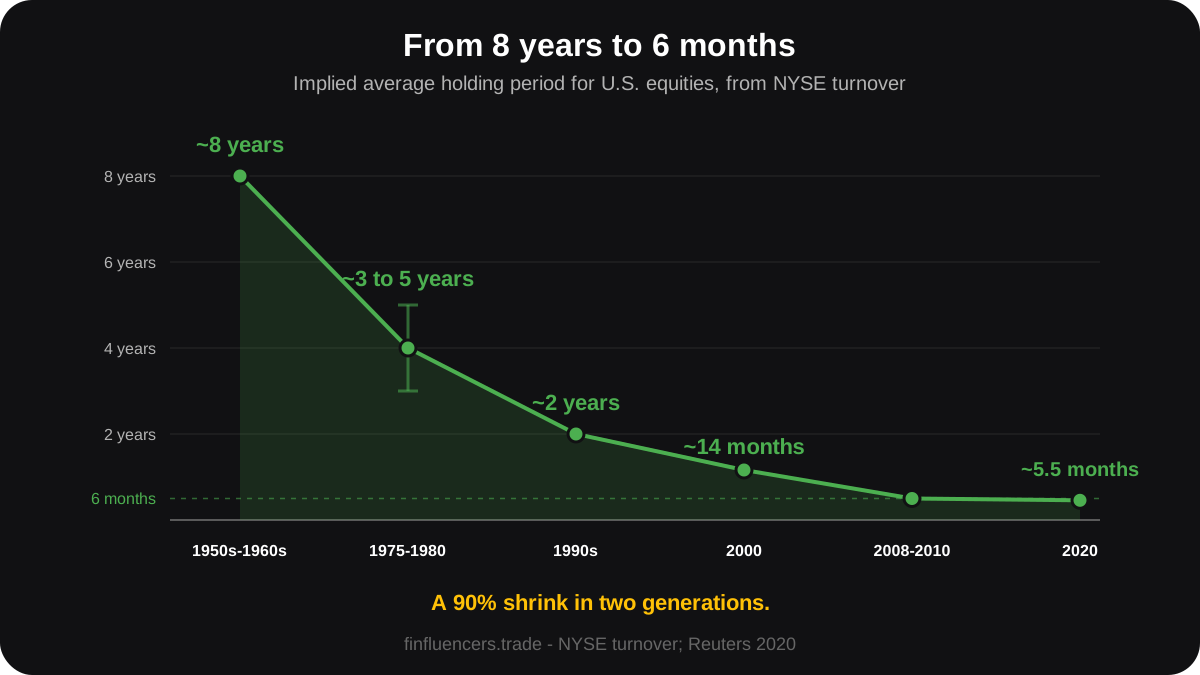
That is a 90% shrink in two generations. The drivers in the same sources are mechanical: fixed commissions ended in 1975, certificates became electronic, spreads went to a penny, commissions went to zero, and high-frequency trading plus ETF create-and-redeem flow added a lot of volume that is not a person changing their mind.
The average is not a person
The turnover formula counts every share that changes hands. A market-maker that flips a share in a second and a pension fund that holds for four years go into the same average. High-frequency firms, quantitative market-makers, and authorized participants in ETFs pull the number down. Dedicated equity funds and endowments still hold for 2 to 4 years. The 6-month figure is the market-wide clock, not a survey of retail accounts.
It is still the right clock for a default. A visitor who lands on a leaderboard is looking at picks that circulate in the same market that now turns over twice a year. Opening on 1 week annualizes noise. Opening on 1 year asks them to wait longer than the market itself usually does. Six months sits on the measured average and still covers a full earnings cycle.
You probably already know your own holding period — how long you usually keep a trade, or the horizon you actually follow. If you do, switch the table to that window. A swing trader should read 1 month. Someone who buys a 3-year story and holds it should read 1 year. The default is for the market's clock, not a substitute for yours.
A 5-year thesis dumped at month 4
The mismatch that matters for this site is not HFT. It is the gap between how a pick is sold and how long it is held.
A speaker puts out a 3-to-5-year story. A listener buys it. Three months later the market is down and the position is red. They sell at month 4. The long thesis never had a chance to be right or wrong. The result in that account was short-term sentiment and market beta.
If the market's typical hold is about 24 weeks, a leaderboard that only shows 1 year hides the window most followers actually live in. A leaderboard that only shows 1 month rewards the week the clip went out. Five windows, with 6 months selected first, is the honest layout: you can see whether a book survived a quarter and a half, and you can still switch to 1 year when you want the longer test.
That is the holding period used on Sector Leaderboards. The three columns on those boards are defined in Sector Alpha and Sector Leaderboards.
What the five windows are for
- 1 week and 1 month — reaction, earnings pops, crowd heat. Useful as a check. Not a default.
- 3 months and 6 months — a quarter, then two. Close to how long the market holds.
- 1 year — whether the pick still looks like stock picking after a full year.
A number without a holding period does not mean much. Half of the speaker-sector series that qualify at every window change sign somewhere between 1 week and 1 year. That is why the control stays. Six months is where the table starts. If you already know how you trade, pick the window that matches that habit.
The formal definition of the holding periods is on Methodology.
Sector Leaderboards at 6 months
The thickest boards, at the window the market actually holds.
Further reading
- Sector Alpha and Sector Leaderboards — Sector Alpha = Stock Picking Alpha + Sector Picking Alpha.
- Buy, sell, repeat! No room for 'hold' in whipsawing markets — Reuters, 3 August 2020, Saikat Chatterjee and Thyagaraju Adinarayan.
- James Montier, The Little Book of Behavioral Investing — the churn-and-burn framing, from Dresdner Kleinwort and NYSE turnover.
The holding-period figures above are the implied averages from NYSE turnover and the Reuters 2020 calculation. They describe market-wide share velocity, not the hold of any one fund or person.
Last updated: 2026-09-15