Sector Alpha and Sector Leaderboards
Imagine a tech stock pick that beat the S&P 500 by 8 points in one year. In the same year, the tech sector ETF also beat the S&P 500 by 8 points. The speaker did not pick a good stock. The speaker picked a good sector.
finfluencers.trade measures these two things separately. Sector Alpha = Stock Picking Alpha + Sector Picking Alpha. You can see the split on Sector Leaderboards for finfluencers and shows, and on every profile.
What Sector Alpha is
Every scored pick on finfluencers.trade is compared to the S&P 500 over the same holding period. Each pick in a GICS sector is also compared to the Vanguard ETF for that sector. For example, VGT for Information Technology, VHT for Health Care, VDE for Energy. Both comparisons use the same start and end dates.
This gives three numbers for each speaker in each sector. They always add up:
- Sector Alpha — the average annualized alpha of the picks in this sector, compared to the S&P 500.
- Stock Picking Alpha — the same average, compared to the sector ETF. A positive number means the speaker's stocks did better than the sector average.
- Sector Picking Alpha — the average of the sector ETF versus the S&P 500 over the same dates. A positive number means the sector itself did better than the market.
Here is one real row, from 14 September 2026. Jim Cramer's Information Technology picks at the 1-year holding period (3,290 picks) have a Sector Alpha of +18.8%. It splits into Stock Picking Alpha +10.5% and Sector Picking Alpha +8.3%. His stocks beat VGT, and VGT beat the S&P 500. When the table is sorted by Stock Picking Alpha he is 9th of 48 finfluencers in this sector. Rankings change as new picks are scored.
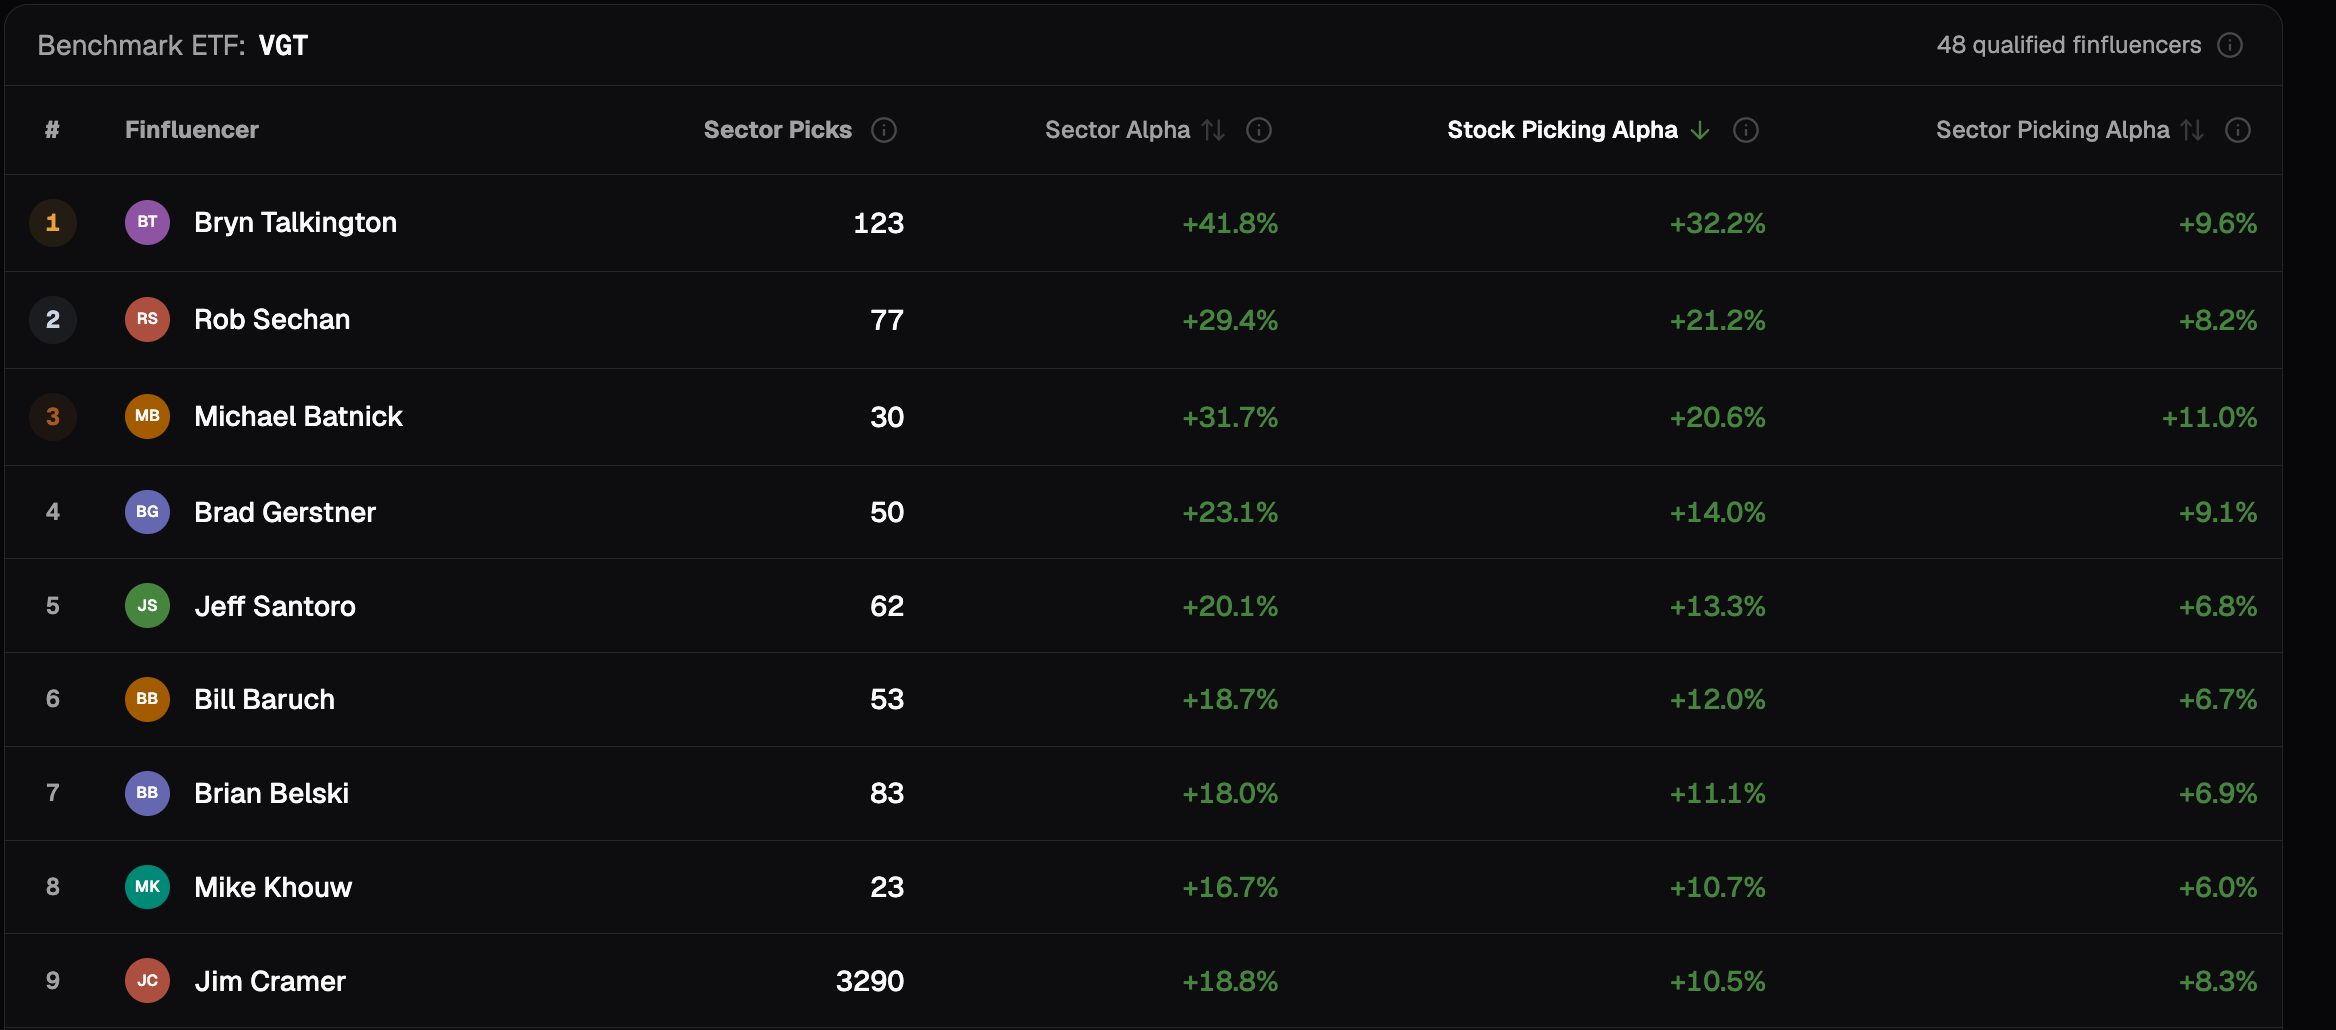
Sector Leaderboards
Sector Leaderboards ranks finfluencers or shows inside one sector. You choose the sector, the holding period (1w, 1m, 3m, 6m, 1y), and the column to sort by. A finfluencer or show needs at least 20 scored picks in the sector to appear.
Same table, two sorts
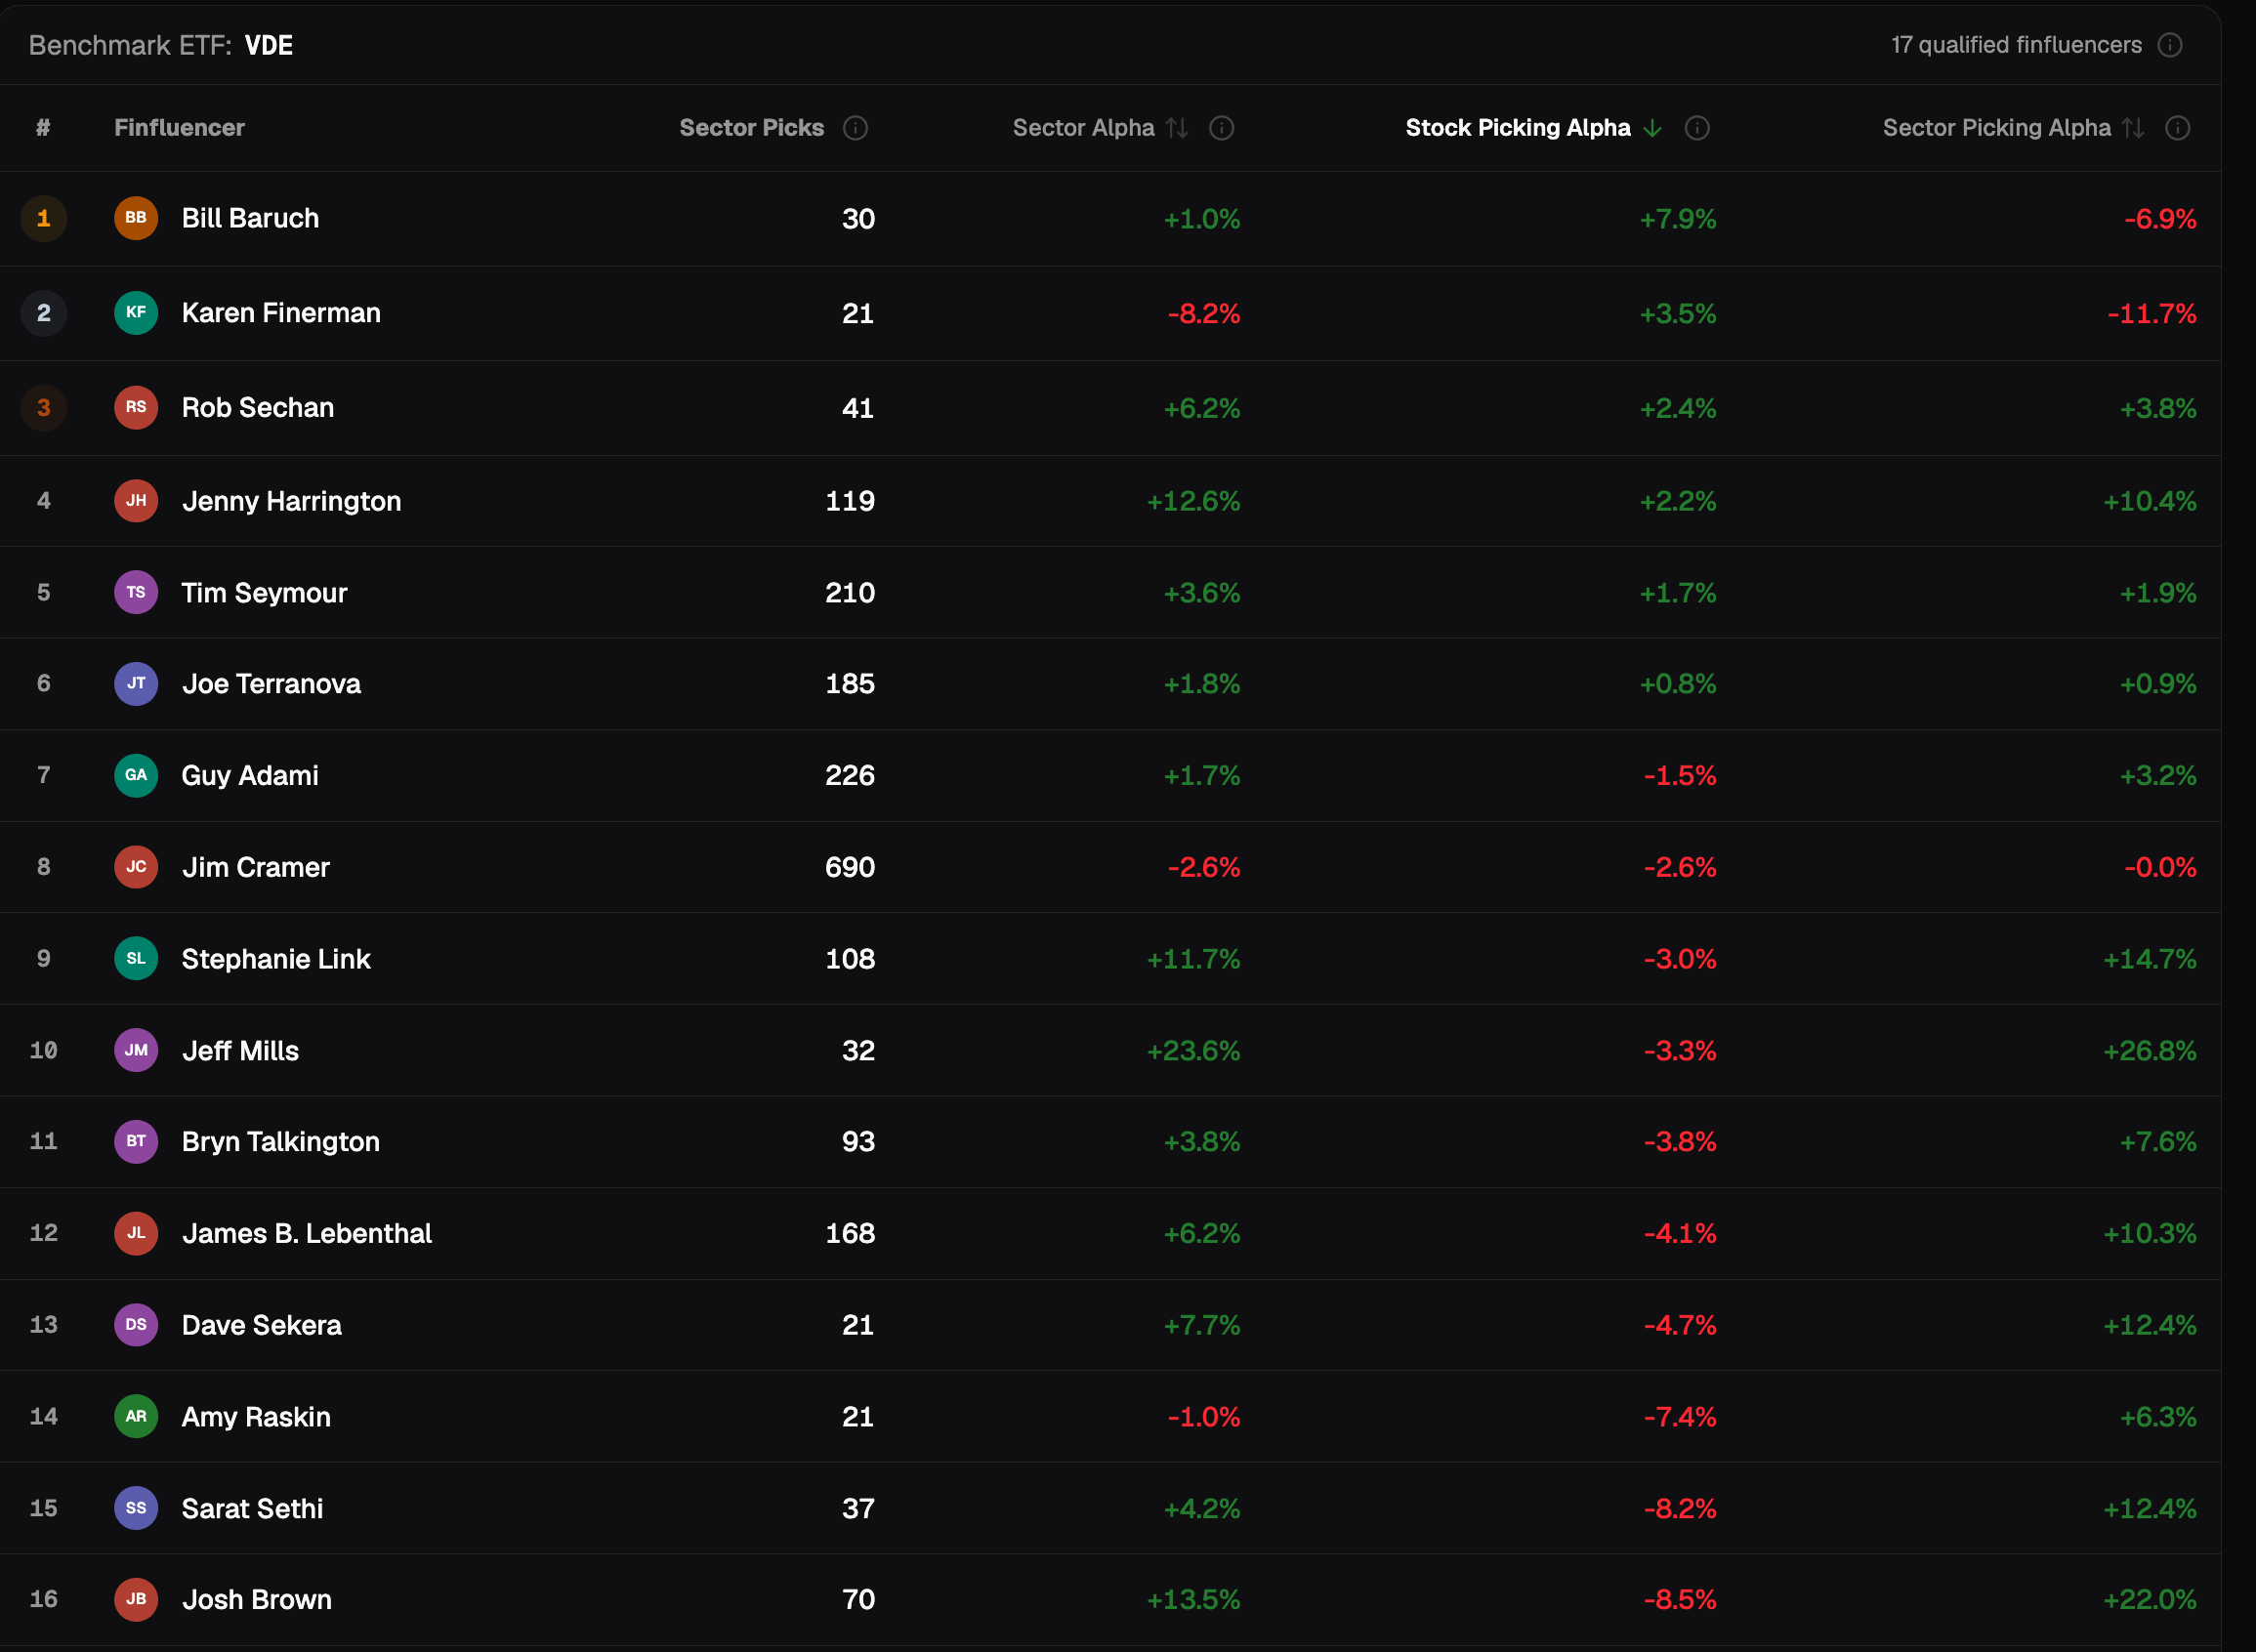
Take Energy at the 6-month holding period. 17 finfluencers qualify. When you sort by Stock Picking Alpha, Josh Brown is 16th of 17. His Stock Picking Alpha is −8.5%. His Sector Picking Alpha is +22.0%.
Sort the same table by Sector Alpha. He is 2nd of 17 with +13.5% (70 picks). The +13.5% came from being in energy, not from the energy stocks he chose.
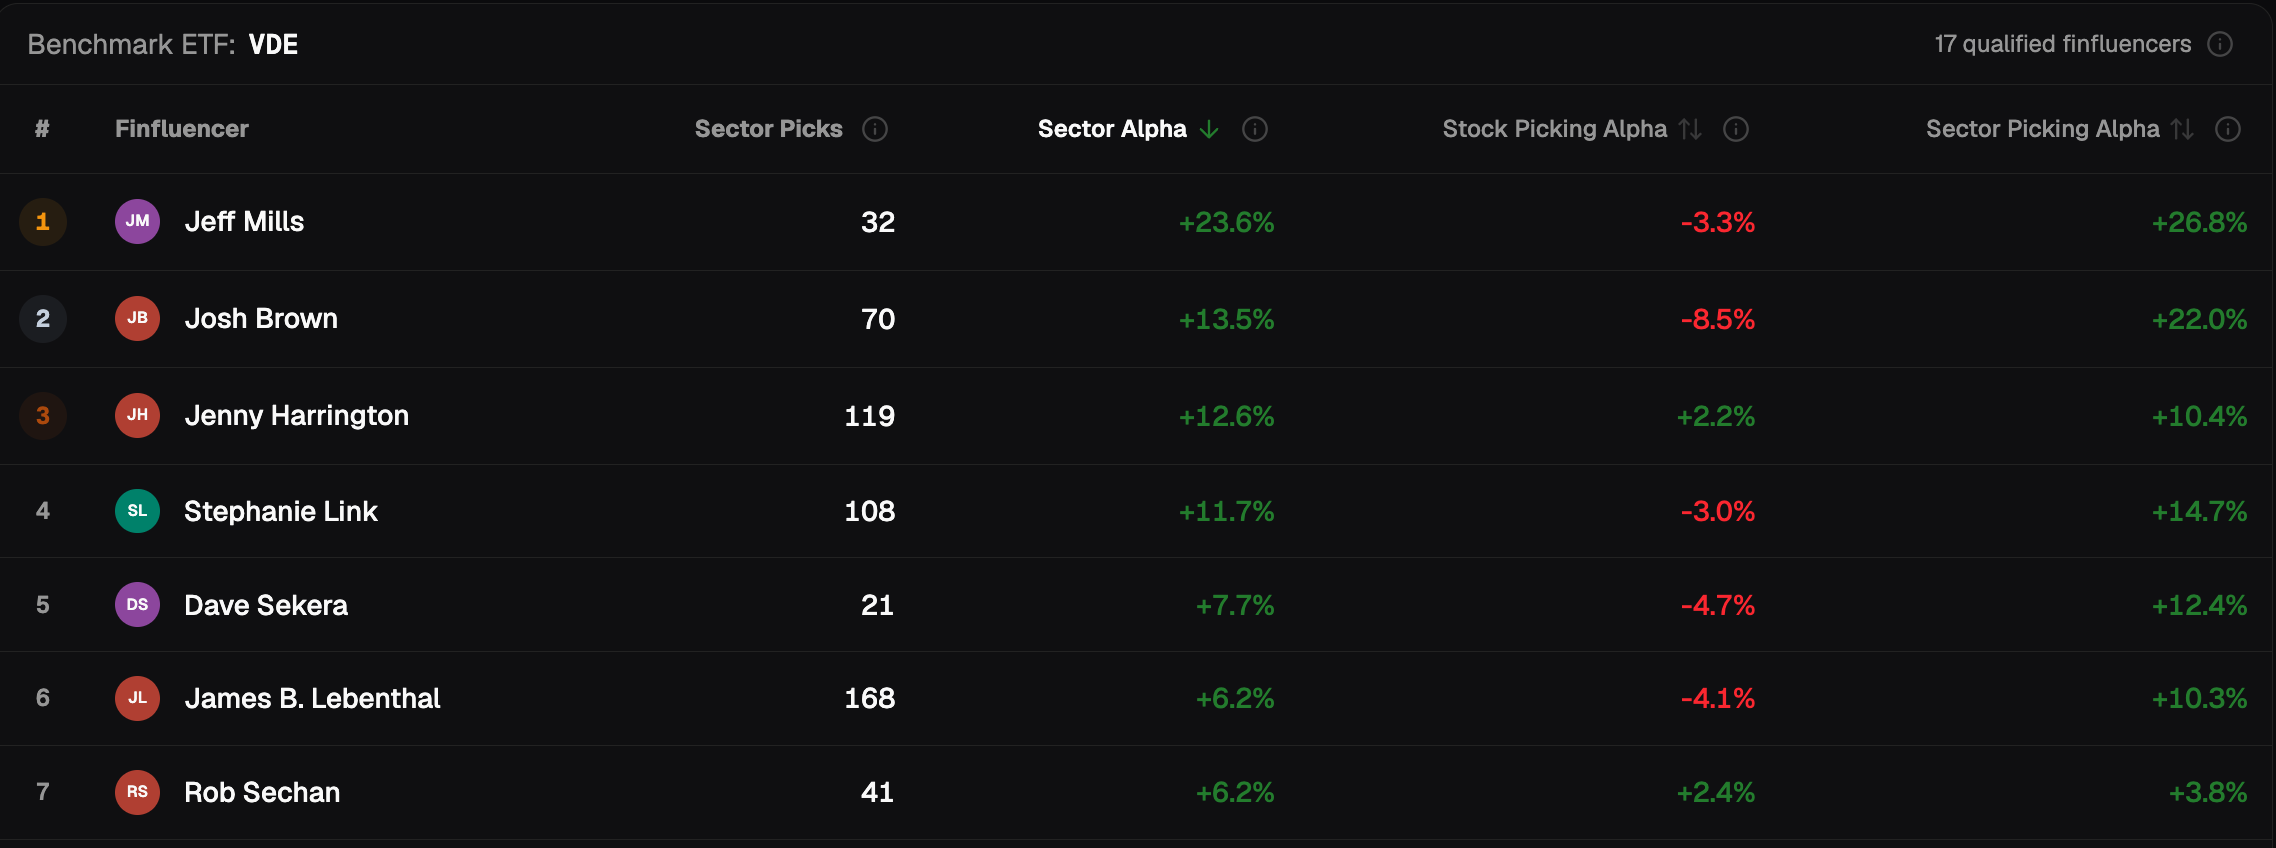
The two columns ask two different questions. Sector Alpha asks whether the picks beat the S&P 500. Stock Picking Alpha asks whether they beat the sector ETF. Josh Brown's Energy book is a yes to the first and a no to the second. A single “vs the S&P 500” number cannot show that.
Open this view on finfluencers.trade
Open Sector Leaderboards. Pick a sector and a holding period. Sort by Stock Picking Alpha, then sort by Sector Alpha. The order of the names changes.
In tech, the sector did the work
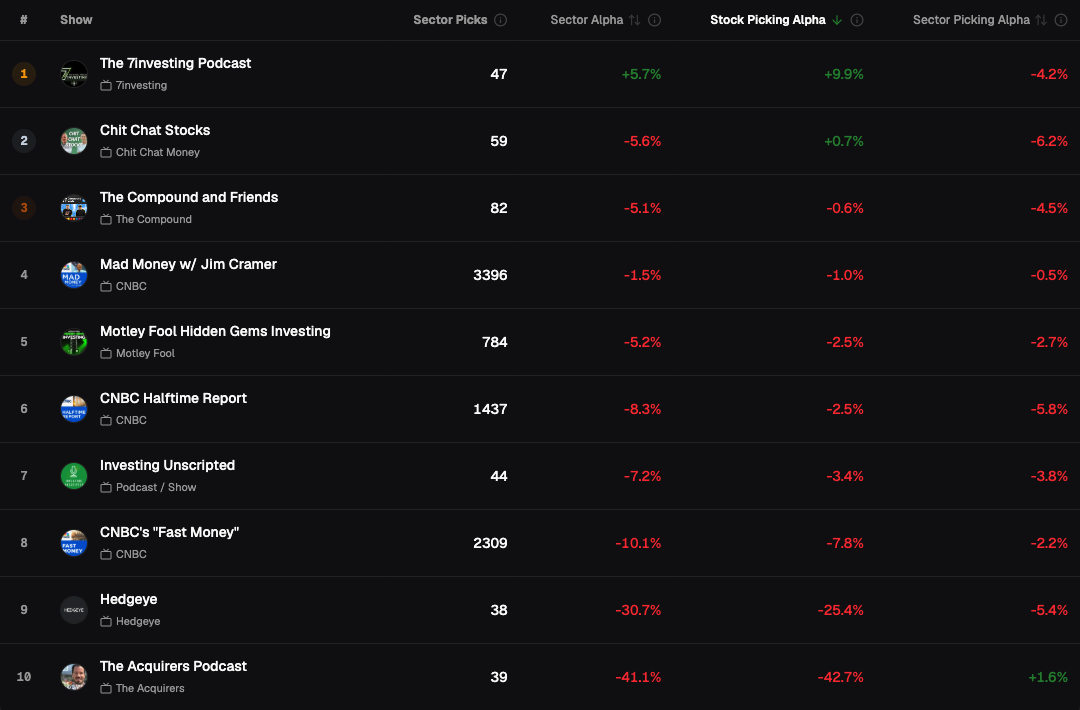
Switch to Shows, choose Information Technology, 1 year. Ten shows qualify. All ten have a positive Sector Picking Alpha, because VGT beat the S&P 500 in their windows. Only 5 of 10 have a positive Stock Picking Alpha. The middle show beat the S&P 500 by 8.7 points and lagged VGT by 0.4 points.
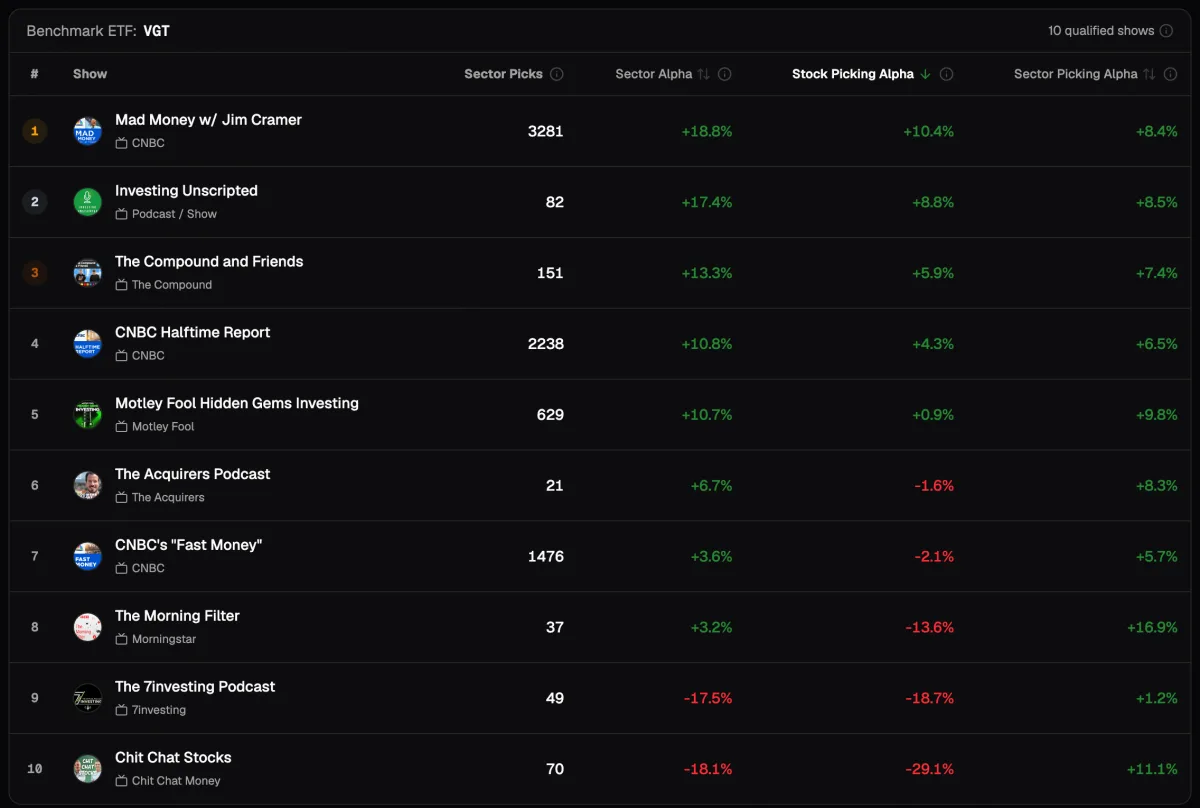
Motley Fool Hidden Gems Investing is a clear example. Its tech Sector Alpha is +10.7% on 629 picks. Only +0.9% of that is Stock Picking Alpha. +9.8% is Sector Picking Alpha. At the 3-month and 6-month holding periods, its tech Stock Picking Alpha is negative (−2.1% and −2.0%). The show was in the right sector. Inside the sector, it was about average.
Open this view on finfluencers.trade
Beats the sector ETF, loses to the S&P 500
The opposite case is the one a plain "vs the S&P 500" number hides.
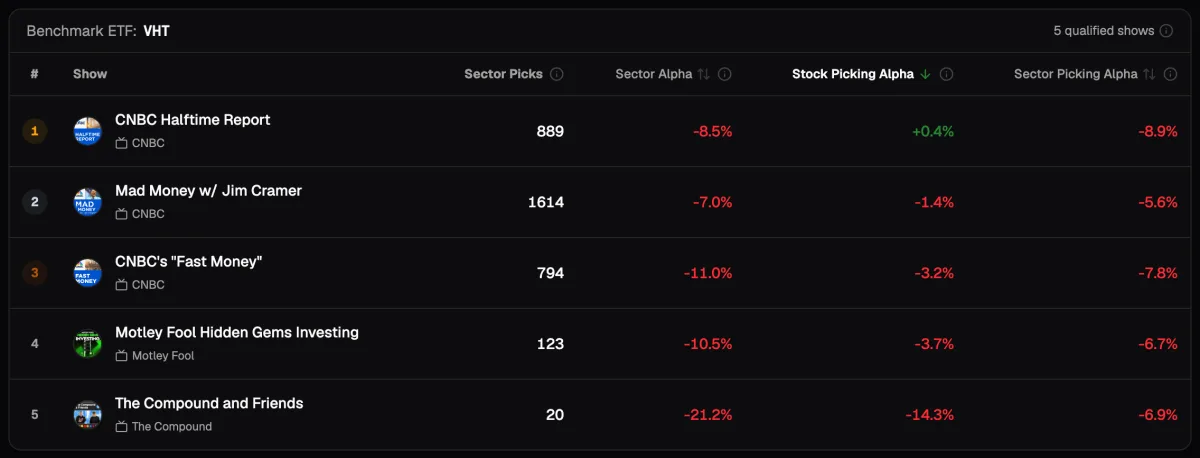
Choose Shows, Health Care, 1 year, and sort by Stock Picking Alpha. CNBC Halftime Report is 1st of 5. Its Sector Alpha is −8.5% on 889 picks. The split is +0.4% Stock Picking Alpha and −8.9% Sector Picking Alpha. The show chose health care stocks about as well as the sector ETF. But the sector itself lost to the S&P 500. When the table is sorted by Sector Alpha, the row is red.
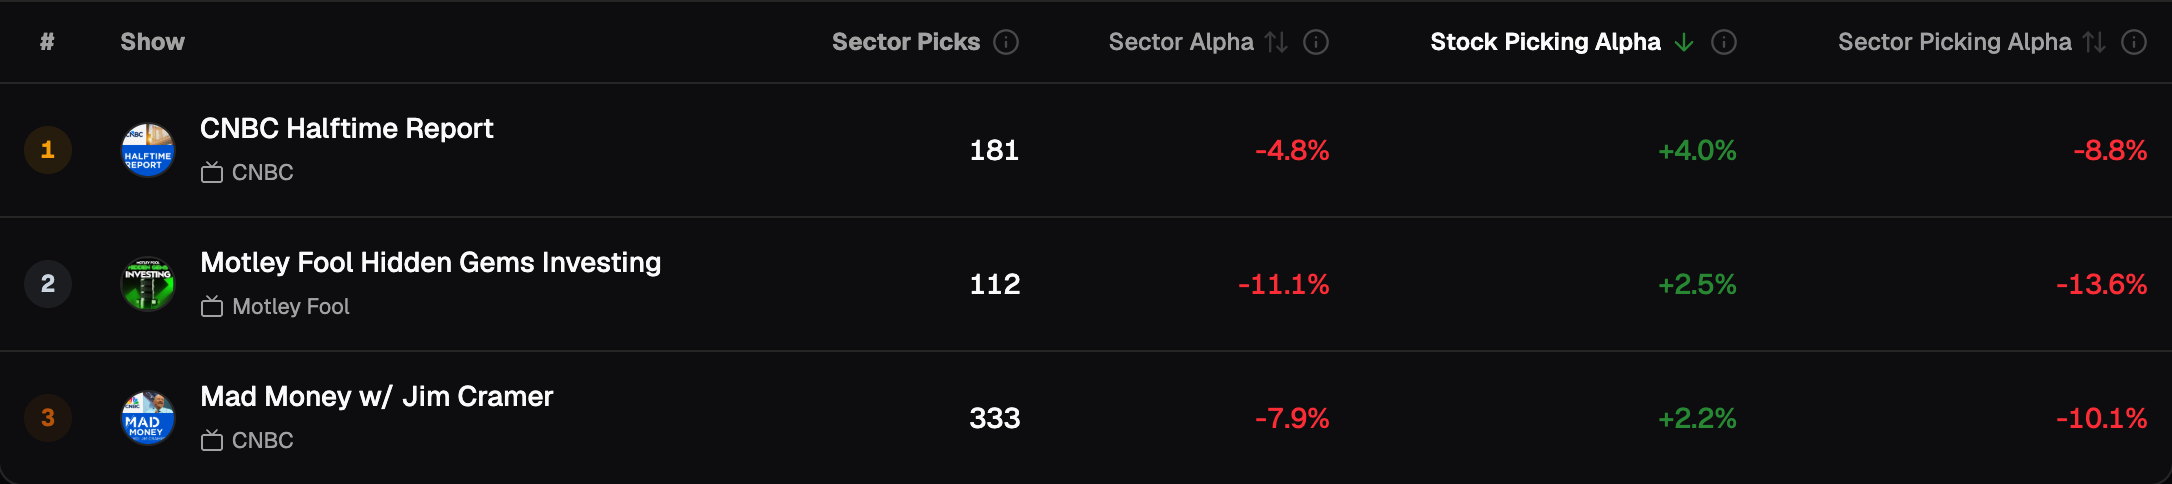
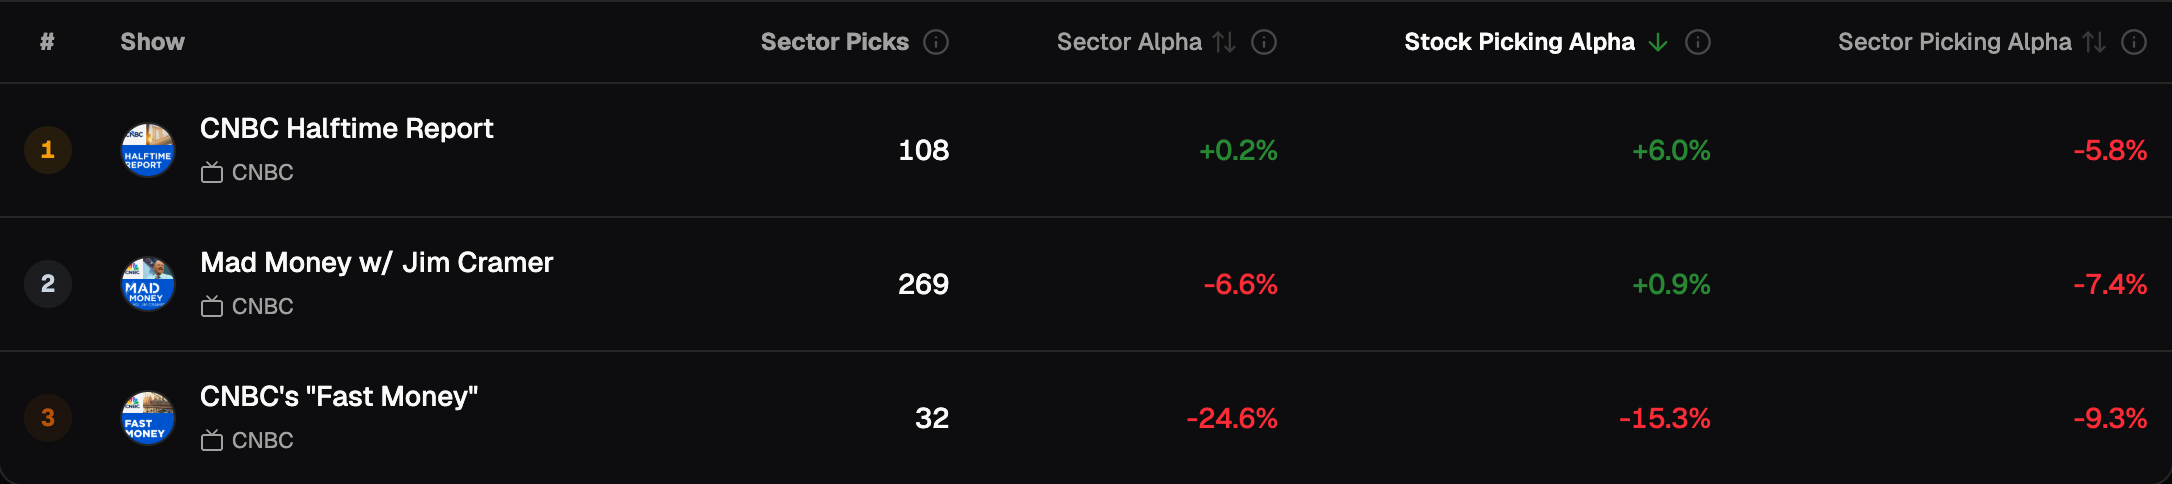
Halftime Report shows the same pattern in Real Estate (Stock Picking Alpha +4.0%, Sector Alpha −4.8%, 181 picks) and in Utilities (+6.0% and +0.2%, 108 picks). It is the top stock picker in three sectors, and its Sector Alpha is negative or close to zero in all three.
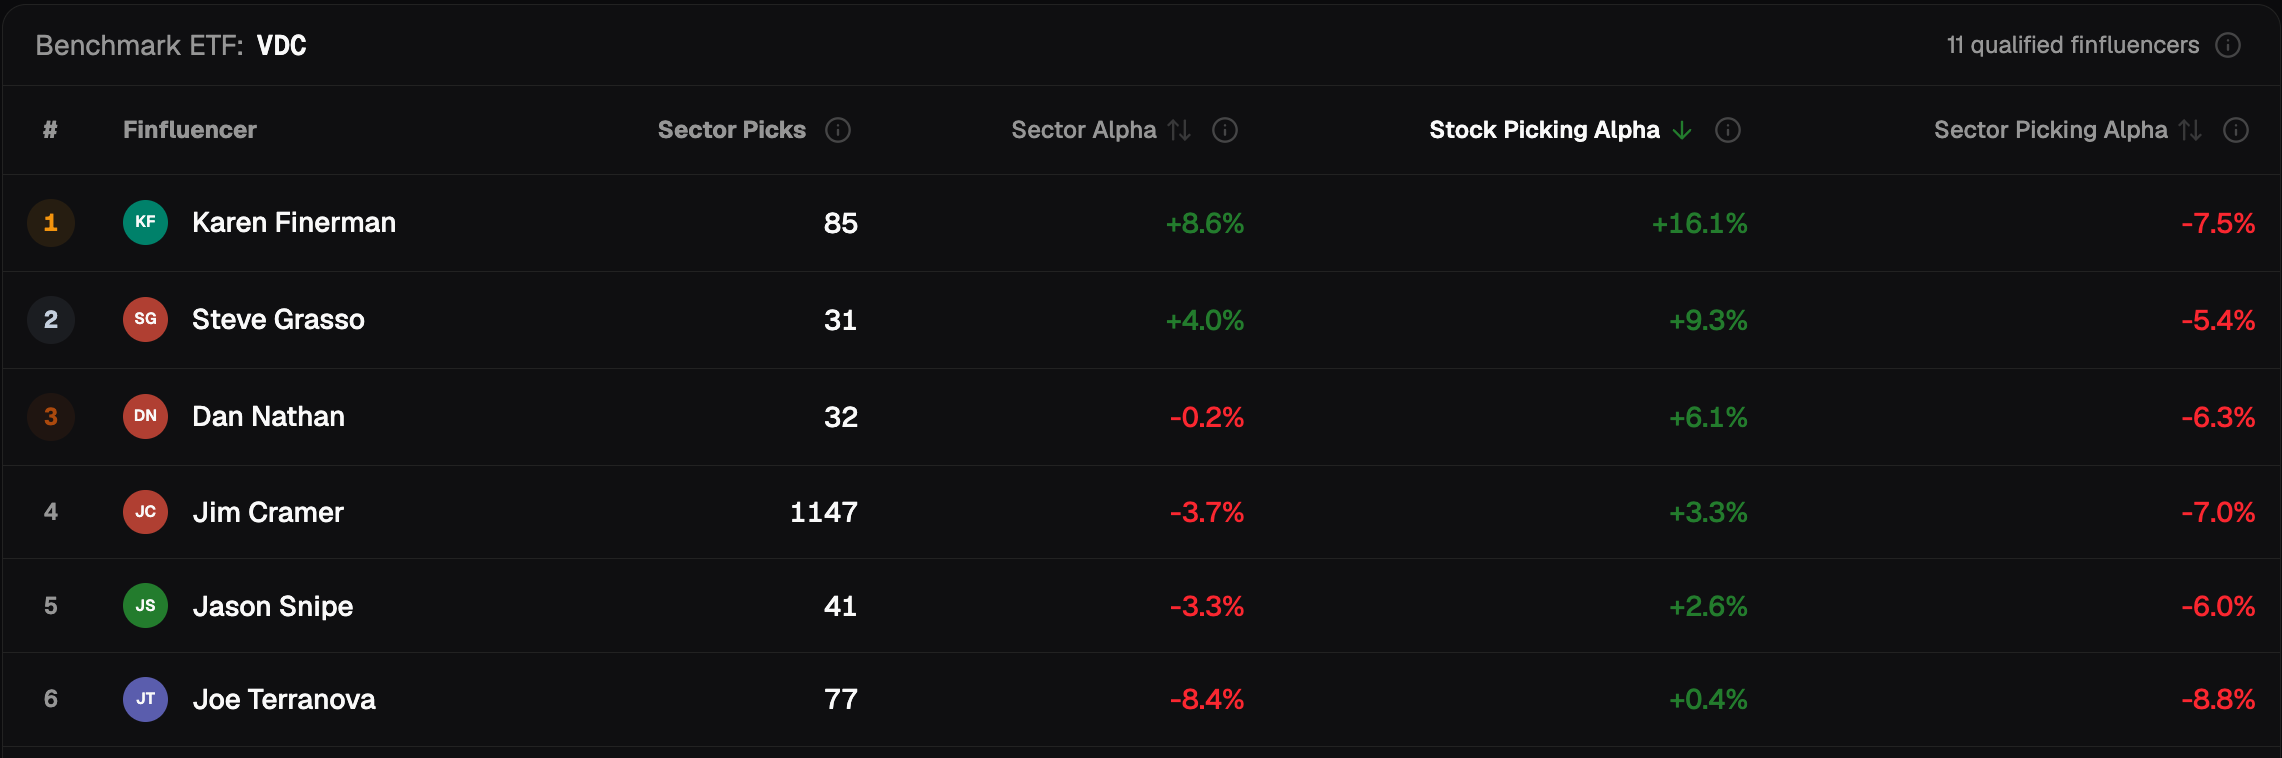
The same thing happens on the finfluencer side. In Consumer Staples at 1 year, the 1st stock picker of 11 is Karen Finerman. Her Stock Picking Alpha is +16.1% on 85 picks. The staples ETF lost to the S&P 500 by 7.5 points in her windows, so her Sector Alpha is +8.6%. Her staples Stock Picking Alpha is positive at every holding period, from one week to one year. 85 picks is a small sample, so treat it as something to watch, not as a final answer.
Open this view on finfluencers.trade
One speaker, every sector
The leaderboard shows one sector for every speaker. The sector widget on a profile shows every sector for one speaker. Finfluencer profiles and show profiles use the same chart and the same table.
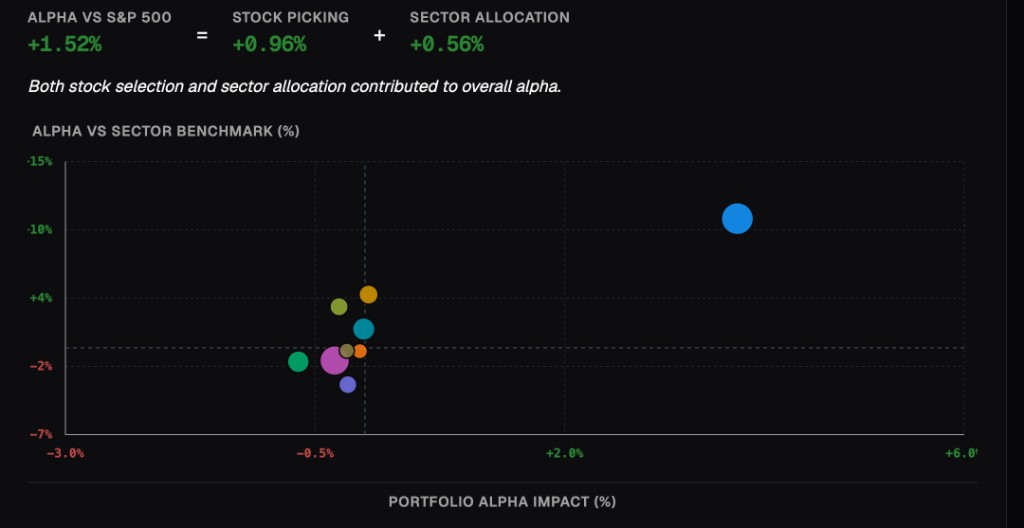
Jim Cramer's 1-year book, read on 14 September 2026, is +1.52% = +0.96% + +0.56%. Both legs helped. Each dot on the chart is one sector. Up is Stock Picking Alpha (the stocks beat the sector ETF). Right is Portfolio Impact (how much that sector moved the whole book). The blue dot on the far right is Information Technology.
The table under the chart is the same data as a list. Information Technology is 22% of his picks (4,837), +10.4% vs VGT, and +3.7% of book-level alpha. That one sector does almost all of the work.
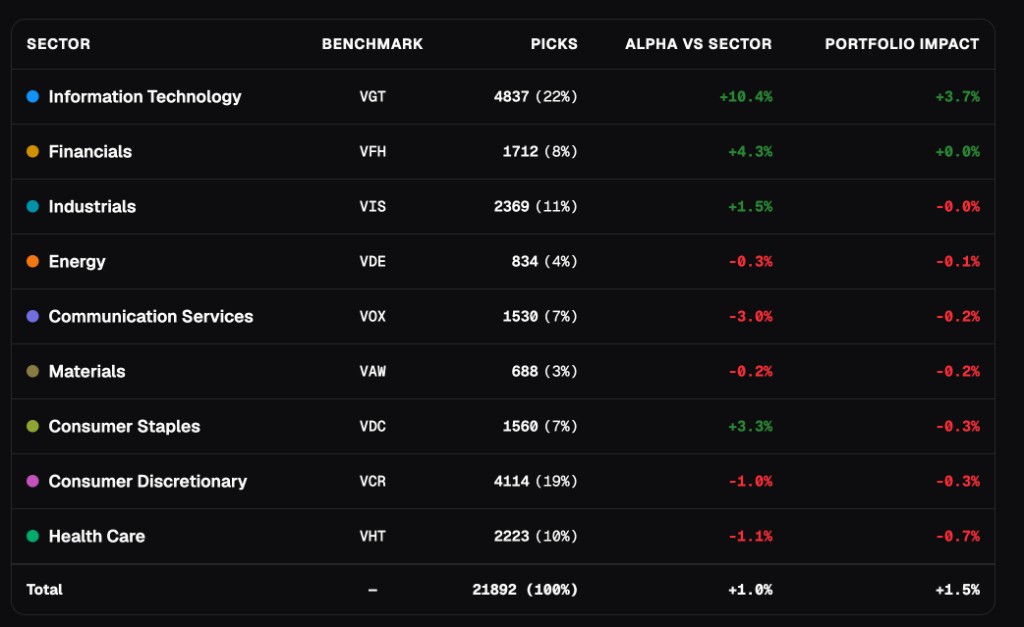
Consumer Staples is the flip you already saw on the leaderboard: he beat VDC by 3.3 points, and Portfolio Impact is still −0.3% because staples lost to the S&P 500. Health Care is the largest drag (−0.7%). Consumer Discretionary is 19% of his picks and close to flat.
Across the 12 equity sectors, his Stock Picking Alpha is positive in 7 and his Sector Alpha is positive in only 3. Beating the sector ETF is not the same as beating the S&P 500.
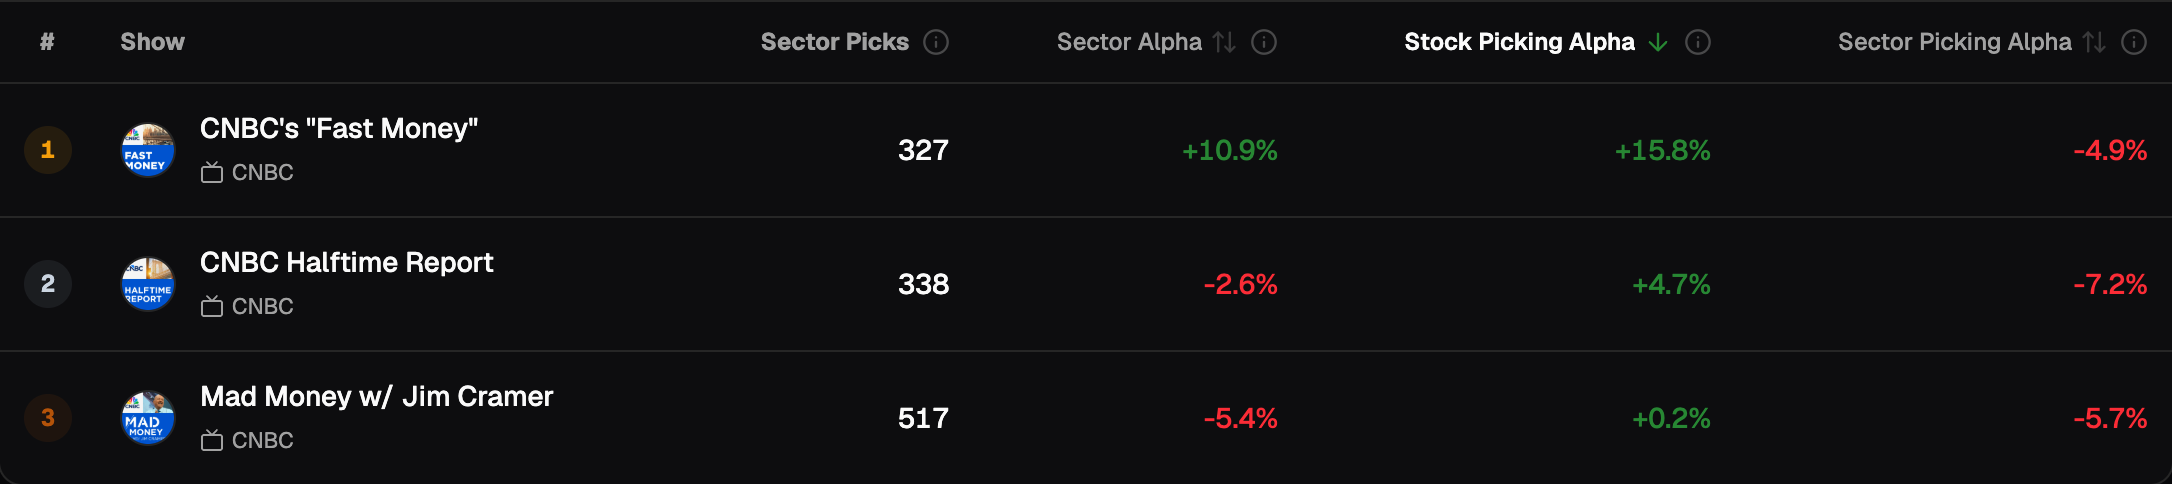
Shows have the same widget. On CNBC's "Fast Money", Materials Stock Picking Alpha is +15.8% on 327 picks, positive at every holding period. Consumer Discretionary, the show's largest sector with 2,309 picks, is −7.8%, negative at every holding period.
Open Jim Cramer's profile · Open Fast Money's profile
How to read these numbers
Three rules I follow myself:
- Always state the holding period. 109 speaker-sector pairs qualify at all five holding periods. 26 have a positive Stock Picking Alpha at all five. 27 have a negative one at all five. 56 change sign somewhere between one week and one year. A number without a holding period does not mean much.
- Look at the pick count. The 20-pick minimum keeps one lucky call off the board. But 20 picks and 2,000 picks are not the same amount of evidence. The count is in every row.
- Both legs are alpha, not return. A negative Sector Picking Alpha does not mean the sector fell. It means the sector ETF did worse than the S&P 500 in those windows.
The full definition is on Methodology → Sector-relative alpha.
Where to start
- Sector Leaderboards
- Energy · 6m · sorted by Sector Alpha · sorted by Stock Picking Alpha
- Jim Cramer profile · CNBC Halftime Report profile
- Methodology — Sector-relative alpha
Sector Leaderboards
Pick a sector and a holding period. Sort by Sector Alpha, then by Stock Picking Alpha, and see who changes place.
One speaker, every sector
Jim Cramer's profile has the sector widget: every sector he has picked in, both legs for each.
Further reading
- Six Months Is the Holding Period We Start From — why 6 months is the holding period we start from.
- Introducing Show Leaderboards & Interactive Profiles — show-level views that Sector Leaderboards sits next to.
- Cumulative Curves, Head-to-Head Compare, and Every Show We Track — how the hypothetical pick book and holding periods work.
- Vanguard sector ETFs — the benchmark funds, one per GICS sector.
- MSCI GICS — the sector classification every pick is mapped to.
All numbers were read from the live Sector Leaderboards and from Jim Cramer's profile sector widget on 2026-09-14, at the stated holding period. Leaderboard ranks use the 20-pick minimum. Rankings change as new picks are scored.
Last updated: 2026-09-14